Quality is a very familiar concept in society. As we know, an item can’t be judged on price alone. If one shirt costs $10, versus another that costs $30, does this mean the cheaper shirt is better based on price alone? Most likely not, as what matters is the quality of the shirts, and how it will perform in the future! In investing, Quality is no different. It starts with a base assumption that all stocks aren’t created equal, some are going to be higher quality than others, and as a result may enjoy better risk-adjusted returns. As consumers we prefer higher quality things, and with stocks it is no different. Indeed, higher quality stocks have historically shown benefits to investors, outperforming over time.[1]
What makes a company a quality company?
There are different approaches to identifying Quality, with associated pros and cons. Warren Buffett, prefers to look for companies with “competitive moats” and companies which exhibit earnings power in excess of its peers. If a business model is easily replicated, one would expect copycats to soon enter, and drive down profitability. Companies with competitive moats have advantages that competitors find difficult to touch, and would be considered higher quality. Many fundamental investors have a Quality screen in place and will also often look for high quality management teams, which are assessed by in person meetings, and other heuristics.
Quality can also be defined by assessing financial metrics in a consistent and disciplined approach. This is an approach BMO GAM has taken for the ETFs listed below, using the MSCI index which BMO’s Quality ETFs are based. 3 metrics are assessed, ROE (Return on Equity), Leverage (Debt to Equity), and Earnings stability (the consistency of earnings through time). Having discipline, and a regular rebalancing schedule to assess and make changes, is of tremendous benefit in investing, to mitigate the role of emotion and behavioural biases, and to ensure the portfolio remains on plan, and true to its intended exposure,
ROE – This is a measure of profitability. Companies with higher profitability are winners in their respective industries. In investing, while things do evolve over time, winners tend to remain winners*1. Higher profitability is a good signal a company has a high-Quality business model.
Low Leverage – High Quality companies tend to be cash rich, from driving solid and consistent business results. Apple is a great example, as is currently sitting on over $60bln of cash and short-term investments2. In short, Quality companies often have less need for debt, so BMO GAM screens for companies with less debt overall.
Earnings Stability – Companies with strong competitive advantages tend to have more consistent earnings streams, as competitors find it difficult to take a “bite out of their lunch”. Quality companies tend to show their merits in earnings consistency through time.
When does Quality tend to perform well, and when may it lag?
Quality companies tend to have a risk level at or slightly below broad markets, and can participate in growth, while maintaining a measure of defensiveness should volatility in markets increase. Investing in higher profitability stocks tends to give the quality exposure a growth flavour, while in negative equity markets quality stocks will often be preferred due to their strong overall balance sheet strength, with less debt and more consistent earnings. As well, higher interest rate environments tend not to be as much a concern for quality companies, as their debt levels are lower, they are less exposed to higher interest rate impacts3.
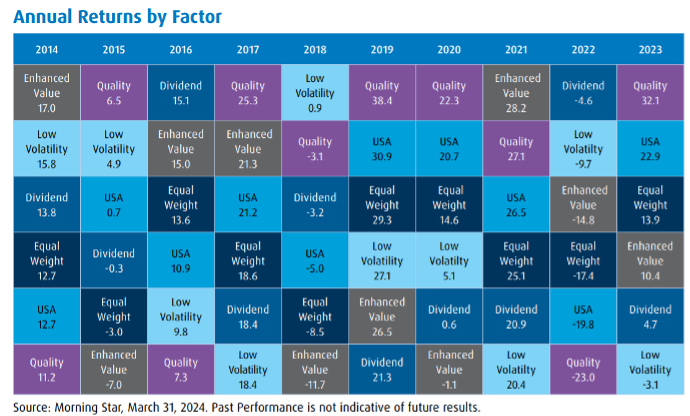
Performance wise, like all factors, Quality is best evaluated versus broad market performance through the entire market cycle, or market cycles. However, as a generalization, Quality stocks tend to do well in growth markets. In very strong bull markets Quality stocks tend to participate well, but higher risk/lower quality stocks may outperform when investors are the most exuberant and take on more risk. In backdrops with higher market volatility, Quality tends to outperform, as company fundamentals and balance sheet strength matter. These are general historical performance trends, and performance in specific market scenarios may vary.
The chart below illustrates factor performance over the past 10 years which shows quality outperforming in many years.
Other considerations
Implementing a quality exposure in your portfolio leads to sector differences and security differences versus the broad index. For example, in the US, Quality tends to overweight Technology companies, as many of these companies fit the bill of high profitability/low debt/consistent earnings, and underweight other sectors such as Consumer Discretionary, where the metrics are not as strong.
In Europe, Technology is not such a large sector in the market, though the Quality sector still has significant differences versus the broad Europe equity market. In particular, less weight on Financials (which tend to be debt heavy), and a higher weight in Health Care and Consumer Staples.
In Global stocks again, we see a higher weighting to the US, and higher weighting to Technology stocks, as globally these stocks screen exceptionally well on the quality metrics.
Overall, the historical track record of MSCI’s Quality Indexes is strong3, however investors should consider how different sector and security exposures may affect their overall portfolio exposures.
Ways an investor can gain exposure to the Quality Factor with BMO ETFs:
BMO offers exposure to the quality factor in 3 regions.
- ZUQ – BMO MSCI USA High Quality Index ETF / F– BMO MSCI USA High Quality Index ETF (Hedged Units) – US Quality Equity Currency Unhedged / Hedged
- ZGQ BMO MSCI All Country World High Quality Index ETF – ACWI Quality (Developed and Emerging markets quality stocks, Currency unhedged)
- ZEQ – BMO MSCI Europe High Quality Hedged to CAD Index ETF – Europe Quality Equity (Currency Hedged)
The first Quality ETF launched by BMO ETFs was ZEQ4 (Europe) in 2014, which proved timely as investors were seeking to diversify, but wanted a way to take a more measured exposure to the region (which was not far removed from a bond crisis in some of the periphery countries). As investor education has continued to advance around the potential benefits of disciplined factor investing, investors are increasingly drawn to Quality ETFs as a tool in the overall portfolio toolkit.
1 *Past Performance is not indicative of future results
3 For a high level overview of Quality performance, see the MSCI report on Quality, Quality-brochure.pdf (msci.com), showing a higher expected return, with lower risk, on an index of World Quality equities.
Disclaimers:
Changes in rates of exchange may also reduce the value of your investment.
Commissions, management fees and expenses all may be associated with investments in exchange traded funds. Please read the ETF Facts or prospectus of the BMO ETFs before investing. Exchange traded funds are not guaranteed, their values change frequently and past performance may not be repeated.
For a summary of the risks of an investment in the BMO ETFs, please see the specific risks set out in the BMO ETF’s prospectus. BMO ETFs trade like stocks, fluctuate in market value and may trade at a discount to their net asset value, which may increase the risk of loss. Distributions are not guaranteed and are subject to change and/or elimination.
BMO ETFs are managed by BMO Asset Management Inc., which is an investment fund manager and a portfolio manager, and a separate legal entity from Bank of Montreal.
Any statement that necessarily depends on future events may be a forward-looking statement. Forward-looking statements are not guarantees of performance. They involve risks, uncertainties and assumptions. Although such statements are based on assumptions that are believed to be reasonable, there can be no assurance that actual results will not differ materially from expectations. Investors are cautioned not to rely unduly on any forward-looking statements. In connection with any forward-looking statements, investors should carefully consider the areas of risk described in the most recent prospectus.
All investments involve risk. The value of an ETF can go down as well as up and you could lose money. The risk of an ETF is rated based on the volatility of the ETF’s returns using the standardized risk classification methodology mandated by the Canadian Securities Administrators. Historical volatility doesn’t tell you how volatile an ETF will be in the future. An ETF with a risk rating of “low” can still lose money. For more information about the risk rating and specific risks that can affect an ETF’s returns, see the BMO ETFs’ prospectus.
This blog post is for information purposes. The information contained herein is not, and should not be construed as, investment, tax or legal advice to any party. Particular investments and/or trading strategies should be evaluated relative to the individual’s investment objectives and professional advice should be obtained with respect to any circumstance.
The viewpoints expressed by the author represents their assessment of the markets at the time of publication. Those views are subject to change without notice at any time. The information provided herein does not constitute a solicitation of an offer to buy, or an offer to sell securities nor should the information be relied upon as investment advice. Past performance is no guarantee of future results. This communication is intended for informational purposes only.
“BMO (M-bar roundel symbol)” is a registered trademark of Bank of Montreal, used under licence.


