


Summary
- Start with a strong foundation – Core Index ETFs provide stability and long-term growth.
- Diversify across key markets – Balance exposure to Canada, the U.S., global equities, bonds and other asset classes.
- Keep costs low – Broad-market index ETFs offer efficient, cost-effective diversification.
Laying a strong foundation for your investments
A strong investment portfolio starts with a solid foundation – just like a well-built house. While some investors focus on chasing trends or timing the market, long-term success comes from having a durable core that can weather all conditions.
That’s where core investments come in. These are broad, diversified holdings designed to provide stability and long-term growth. Unlike non-core investments – which might focus on specific sectors, themes, or short-term opportunities – core holdings serve as the backbone of your portfolio, offering steady exposure to key markets with low costs.
Core vs. non-core investments
Core investments typically include diversified ETFs that track broad-market indexes, providing exposure to large segments of the economy. These investments aim to generate long-term, sustainable returns with relatively low volatility. Because they cover broad markets, core investments often require minimal adjustments, making them ideal for long-term investors.
Non-core investments – also known as the “satellite” portion of a portfolio – on the other hand are used to enhance a portfolio’s risk-return profile. These might include thematic ETFs, sector-specific funds, or individual stocks, which can add growth potential but also introduce more volatility. While satellite investments can be valuable for tactical positioning, they should complement – rather than replace – a strong core.
To help you build a strong investment foundation, here are five ETFs that can serve as the pillars of a well-balanced core portfolio:
1. BMO S&P 500 Index ETF (ZSP) – Exposure to U.S. market leadership
If the core are the foundational pillars of a portfolio, the U.S. S&P 500 might be the most important of those pillars – the cornerstones, if you will. According to data from S&P Dow Jones Indices, the S&P 500 accounted for more than half of the world’s stock market value as at the end of 20231.
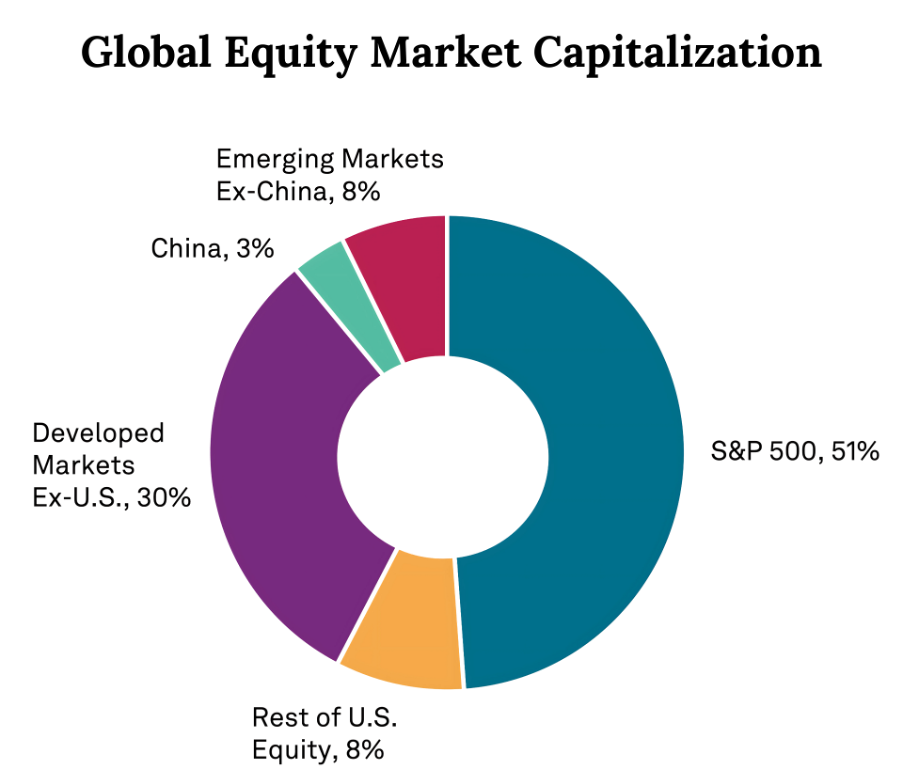
Sources: S&P Dow Jones Indices LLC1. Data as of Dec. 31, 2023. Chart is based on index market capitalization of the S&P 500, S&P Global BMI and its component indices. Past performance is no guarantee of future results. Chart is provided for illustrative purposes.
In fact, all but one of the top 10 largest companies globally are included in the S&P 500, and of the 14 companies with a market capitalization over CA$1 trillion, 12 are in the index2.
- The U.S. stock market has been a powerhouse of global growth, driven by some of the world’s most innovative and profitable companies.
- Tracks the S&P 500, which includes market leaders like Apple, Microsoft, and Amazon.
- Provides exposure to a broad range of industries, from technology to healthcare to consumer goods.
- The U.S. has historically been a strong driver of long-term portfolio returns, benefiting from a robust economy and corporate earnings growth.
- Management Expense Ratio (MER):09% 3
- Annualized Distribution Yield:90% as of Feb 25, 2025
For Canadian investors, BMO S&P 500 Index ETF (ZSP)3 offers a simple, cost-effective way to participate in U.S. market growth without the need to pick individual stocks.
2. BMO S&P/TSX Capped Composite Index ETF (ZCN) – Canada’s economic backbone
Canada’s economy is rooted in key sectors like financial services, natural resources, and industrials. The makeup of the S&P/TSX Capped Composite Index is markedly different from the S&P 500, so for any portfolio weighted heavily towards either the Canadian or U.S. markets, the other serves as an effective diversifier.
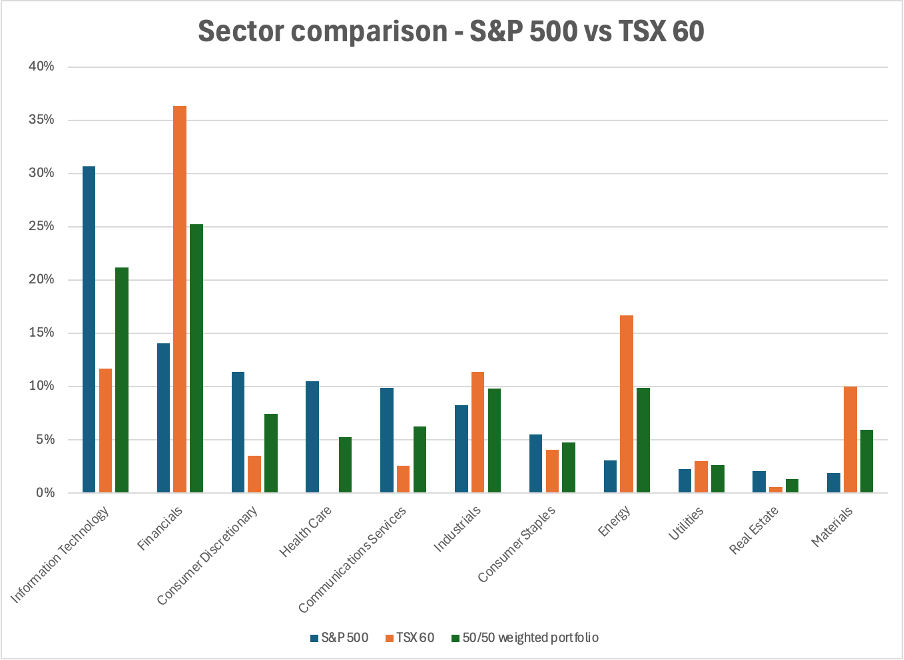
Sources: S&P Dow Jones Indices (data) 1, BMO (analysis and chart). As of 31 January 2025.
- Tracks the S&P/TSX Capped Composite Index, representing over 200 of the largest and most stable Canadian companies.
- Canadian banks and commodity producers have historically provided resilience and steady income, making them a strong foundation for domestic investors.
- Helps investors benefit from Canada’s economic stability and resource-driven growth.
- MER:06% 4
- Annualized Distribution Yield:72% as of Feb 25, 2025
BMO S&P/TSX Capped Composite Index ETF (ZCN)4 ensures that Canadian investors have core exposure to their home market, helping to balance international investments.
3. BMO Aggregate Bond Index ETF (ZAG) – The stability factor
Bonds could be thought of as the mortar holding together the equity ‘bricks’ in your portfolio. While equities drive growth, bonds provide stability.
Bonds have historically had a low correlation with equities5, meaning that they don’t always move in the same direction or by the same amount. Holding different assets with low correlations is the basis of effective diversification, which is why a well-balanced portfolio should include fixed income.
- A core Canadian bond ETF that includes a mix of government and corporate bonds.
- Helps smooth out market volatility by providing more predictable returns, especially in times of economic uncertainty.
- Bonds play a key role in capital preservation and steady cash flow generation.
- MER:09% p 6
- Annualized Distribution Yield:40% as of February 25, 2025
By including BMO Aggregate Bond Index ETF (ZAG)6, investors can add a layer of protection to their portfolio while maintaining consistent returns.
4. BMO MSCI EAFE Index ETF (ZEA) – Global diversification beyond North America
North American markets have been world leaders in recent decades. But the future may not look like the past, so it’s important to spread your bets outside the U.S. and Canada. Additionally, the sector allocations for the MSCI EAFE Index look notably different again from either the S&P 500 Index or the S&P/TSX Capped Composite Index7, helping to further improve diversification.
- Provides exposure to developed markets outside North America, including Europe, Japan, and Australia.
- Global diversification can reduce risk and capture growth opportunities abroad.
- Access to major multinational corporations that may not be well represented in Canadian or U.S. indexes.
- Helps spread risk across different economies, reducing reliance on any single market.
- MER:20%8
- Annual Distribution Yield:57%* as of Feb 25, 2025
With BMO MSCI EAFE Index ETF (ZEA)8, investors can ensure their portfolios are positioned to benefit from opportunities across the global economy.
5. BMO Gold Bullion ETF (ZGLD) – A hedge against uncertainty
Gold has long been regarded as a safe-haven asset, and is thought to provide protection during economic downturns and market volatility. Gold is also considered a ‘store of value’, meaning that it should roughly hold its real value over the very long term.
- Provides direct exposure to gold, an asset known for preserving value during inflation and financial instability.
- Historically, gold has had a low correlation with stocks and bonds, making it a useful diversifier.
- A strategic allocation to gold can help offset risks from equity and currency fluctuations.
- MER:23%9
- Annual Distribution Yield: N/A (Gold does not generate cash flow)
Adding a small allocation to gold through BMO Gold Bullion ETF (ZGLD)9 can enhance a portfolio’s resilience against unpredictable market conditions.
Building a stronger portfolio
By incorporating these ideas within the core of a portfolio, investors can create a well-balanced, resilient portfolio that can stand the test of time.
A strong core means you don’t have to constantly react to market swings – it’s built to last, providing steady exposure to key markets while helping manage risk. Whether you’re just starting or refining your investment strategy, focusing on core holdings can simplify investing and set you up for long-term success.
Volatility: Measures how much the price of a security, derivative, or index fluctuates. The most commonly used measure of volatility when it comes to investment funds is standard deviation.
Standard Deviation: A measure of risk in terms of the volatility of returns. It represents the historical level of volatility in returns over set periods. A lower standard deviation means the returns have historically been less volatile and vice-versa. Historical volatility may not be indicative of future volatility.
Sources:
- S&P Dow Jones Indices, S&P 500: The Gauge of the U.S. Large-Cap Market (2024).
- Companies Market Cap, Largest Companies by Marketcap, as at 20 February 2025.
- BMO S&P 500 Index ETF CAD (ZSP) as of January 31, 2025, YTD 3.90%, 1Y 36.21%, 2Y 28.70%, 3Y 16.63%, 5Y 16.96%, 10Y 14.87%, SI 18.20%, Inception Date Nov 14, 2012.
- BMO S&P/TSX Capped Composite Index ETF (ZCN) as of January 31, 2025: YTD 3.47%, 1Y 25.07%, 2Y 14.36%, 3Y 9.91%, 5Y 11.42%, 10Y 8.94% SI 8.53%, Inception Date May 29, 2009.
- ZAG correlation with AZP is 0.46, and with ZCN is 0.43. Based on 12-month rolling correlation, using monthly returns for 12-01-2012 to 01-31-2025. Data sources from portfoliovizualizer.com.
- BMO Aggregate Bond Index ETF (ZAG) as of January 31, 2025, YTD 1.20%, 1Y 6.89%, 2Y 4.44%, 3Y 0.90%, 5Y 0.36%, 10Y 1.51%, SI 2.91%, Inception Date Jan 19, 2010.
- MSCI, EAFE Index Fact Sheet (January 2025).
- BMO MSCI EAFE Index ETF (ZEA) as of January 31, 2025, YTD 6.21%, 1Y 17.68%, 2Y 13.43%, 3Y 9.17%, 5Y 8.10%, 10Y 7.00%, SI 7.51%, Inception Date February 10, 2014.
- BMO Gold Bullion ETF (ZGLD) Inception date of Mar 4, 2024
Idex Online, An Ounce Of Gold Equals Price Of A “Decent” Suit? (2011), David Beahm, What’s An Ounce of Gold Really Worth? Ask Your Tailor (2017), Schiff Gold, Does Gold Really Preserve Purchasing Power? The Case of the High-End Suit (2023).
Disclaimers
Any statement that necessarily depends on future events may be a forward-looking statement. Forward-looking statements are not guarantees of performance. They involve risks, uncertainties and assumptions. Although such statements are based on assumptions that are believed to be reasonable, there can be no assurance that actual results will not differ materially from expectations. Investors are cautioned not to rely unduly on any forward-looking statements. In connection with any forward-looking statements, investors should carefully consider the areas of risk described in the most recent simplified prospectus.
Management Expense Ratios (MERs) are the audited MERs as of the fund’s fiscal year end. MER might not be displayed if the fund is less than one year old since the audited MER of the fund has not gone through a financial reporting period.
Third Party Links and Content
This article may contain links to other sites that BMO Global Asset Management does not own or operate. Also, links to sites that BMO Global Asset Management owns or operates may be featured on third party websites on which we advertise, or in instances that we have not endorsed. Links to other websites or references to products, services or publications other than those of BMO Global Asset Management on this [article, presentation, communication, material – revise as appropriate] do not imply the endorsement or approval of such websites, products, services or publication by BMO Global Asset Management. We do not manage, and we are not responsible for, the digital marketing and cookie practices of third parties. The linked websites have separate and independent privacy statements, notices and terms of use, which we recommend you read carefully.
Any content from or links to a third-party website are not reviewed or endorsed by us. You use any external websites or third-party content at your own risk. Accordingly, we disclaim any responsibility for them.
This yield is calculated by taking the most recent regular distribution, or expected distribution, (excluding additional year end distributions) annualized for frequency, divided by current NAV. The yield calculation does not include reinvested distributions.
Index returns do not reflect transactions costs or the deduction of other fees and expenses and it is not possible to invest directly in an Index. Past performance is not indicative of future results.
Distribution yields are calculated by using the most recent regular distribution, or expected distribution, (which may be based on income, dividends, return of capital, and option premiums, as applicable) and excluding additional year end distributions, and special reinvested distributions annualized for frequency, divided by current net asset value (NAV). The yield calculation does not include reinvested distributions.
Distributions are not guaranteed, may fluctuate and are subject to change and/or elimination. Distribution rates may change without notice (up or down) depending on market conditions and NAV fluctuations.
The payment of distributions should not be confused with the BMO ETF’s performance, rate of return or yield. If distributions paid by a BMO ETF are greater than the performance of the investment fund, your original investment will shrink. Distributions paid as a result of capital gains realized by a BMO ETF, and income and dividends earned by a BMO ETF, are taxable in your hands in the year they are paid.
Your adjusted cost base will be reduced by the amount of any returns of capital. If your adjusted cost base goes below zero, you will have to pay capital gains tax on the amount below zero.
Cash distributions, if any, on units of a BMO ETF (other than accumulating units or units subject to a distribution reinvestment plan) are expected to be paid primarily out of dividends or distributions, and other income or gains, received by the BMO ETF less the expenses of the BMO ETF, but may also consist of non-taxable amounts including returns of capital, which may be paid in the manager’s sole discretion. To the extent that the expenses of a BMO ETF exceed the income generated by such BMO ETF in any given month, quarter, or year, as the case may be, it is not expected that a monthly, quarterly, or annual distribution will be paid. Distributions, if any, in respect of the accumulating units of BMO Short Corporate Bond Index ETF, BMO Short Federal Bond Index ETF, BMO Short Provincial Bond Index ETF, BMO Ultra Short-Term Bond ETF and BMO Ultra Short-Term US Bond ETF will be automatically reinvested in additional accumulating units of the applicable BMO ETF. Following each distribution, the number of accumulating units of the applicable BMO ETF will be immediately consolidated so that the number of outstanding accumulating units of the applicable BMO ETF will be the same as the number of outstanding accumulating units before the distribution. Non-resident unitholders may have the number of securities reduced due to withholding tax. Certain BMO ETFs have adopted a distribution reinvestment plan, which provides that a unitholder may elect to automatically reinvest all cash distributions paid on units held by that unitholder in additional units of the applicable BMO ETF in accordance with the terms of the distribution reinvestment plan. For further information, see the distribution policy in the BMO ETFs’ simplified prospectus.
The viewpoints expressed by the author represents their assessment of the markets at the time of publication. Those views are subject to change without notice at any time. The information provided herein does not constitute a solicitation of an offer to buy, or an offer to sell securities nor should the information be relied upon as investment advice. Past performance is no guarantee of future results. This communication is intended for informational purposes only.
All investments involve risk. The value of an ETF can go down as well as up and you could lose money. The risk of an ETF is rated based on the volatility of the ETF’s returns using the standardized risk classification methodology mandated by the Canadian Securities Administrators. Historical volatility doesn’t tell you how volatile an ETF will be in the future. An ETF with a risk rating of “low” can still lose money. For more information about the risk rating and specific risks that can affect an ETF’s returns, see the BMO ETFs’ simplified prospectus.
This article is for information purposes only. The information contained herein is not, and should not be construed as investment, tax or legal advice to any party. Particular investments and/or trading strategies should be evaluated and professional advice should be obtained with respect to any circumstance.
The ETF referred to herein is not sponsored, endorsed, or promoted by MSCI and MSCI bears no liability with respect to the ETF or any index on which such ETF is based. The ETF’s prospectus contains a more detailed description of the limited relationship MSCI has with the Manager and any related ETF.
The Index is a product of S&P Dow Jones Indices LLC or its affiliates (“SPDJI”), and has been licensed for use by the Manager. S&P®, S&P 500®, US 500, The 500, iBoxx®, iTraxx® and CDX® are trademarks of S&P Global, Inc. or its affiliates (“S&P”) and Dow Jones® is a registered trademark of Dow Jones Trademark Holdings LLC (“Dow Jones”), and these trademarks have been licensed for use by SPDJI and sublicensed for certain purposes by the Manager. The ETF is not sponsored, endorsed, sold or promoted by SPDJI, Dow Jones, S&P, their respective affiliates, and none of such parties make any representation regarding the advisability of investing in such product(s) nor do they have any liability for any errors, omissions, or interruptions of the Index.
BMO Global Asset Management is a brand name under which BMO Asset Management Inc. and BMO Investments Inc. operate.
Commissions, management fees and expenses all may be associated with investments in exchange traded funds. Please read the ETF Facts or simplified prospectus of the BMO ETFs before investing. The indicated rates of return are the historical annual compounded total returns including changes in unit value and reinvestment of all dividends or distributions and do not take into account sales, redemption, distribution or optional charges or income taxes payable by any unitholder that would have reduced returns. Exchange traded funds are not guaranteed, their values change frequently and past performance may not be repeated.
For a summary of the risks of an investment in the BMO ETFs, please see the specific risks set out in the BMO ETF’s simplified prospectus. BMO ETFs trade like stocks, fluctuate in market value and may trade at a discount to their net asset value, which may increase the risk of loss. Distributions are not guaranteed and are subject to change and/or elimination.
BMO ETFs are managed by BMO Asset Management Inc., which is an investment fund manager and a portfolio manager, and a separate legal entity from Bank of Montreal.
“BMO (M-bar roundel symbol)” is a registered trademark of Bank of Montreal, used under licence.


")


