


Duration
- One of the more important themes over the past several months has been the sell-off in the long-end across numerous jurisdictions.
- Of course, this theme has been led by a combination of macro and idiosyncratic factors – the latter of which has resulted in considerable spillover effects.
- In the U.S., long-end nominal yields have risen since the Federal Reserve (Fed) cut rates in September. That’s atypical from prior cycles –usually long-end nominal yields either remain steady or decline in the months after an easing cycle begins (see Chart 1).
- Nevertheless, it’s important to understand what’s behind the recent rise in long-end yields to better contextualize the rate environment that we appear to be heading into.
- For instance, U.S. 10-year nominal yields have risen by around 97 basis points (bps) since the Fed began easing in September. If we break this rise down into basic components, we see that 10-year breakeven yields1 (a proxy for long-term inflation expectations) have increased by 32 bps, while 10-year real yields (use to proxy long-run growth expectations and/or term premiums) are up by 65 bps over that time.
- Having said the above, it still behooves us to understand the move behind real yields – since they are contributing so much to the shift higher in long-term yields. Over the past few years, we’ve been able to use real yields as a proxy for long-run growth alone given that the term premium2 (really a catch-all phrase meant to encompass duration risk) was modelled to be close to zero and/or negative. However, the New York Federal Reserve’s model tells us something interesting – that the 10-year term premium has risen by close to 88 bps since the September Federal Open Market Committee meeting.
- Indeed, the rise in term premium is the most proximate reason for the sell-off (or the rise in yields). The higher premium reflects the risks of owning longer-dated bonds amidst a backdrop of strong data and the corresponding risk that the Fed could hike rates again, or that U.S. fiscal policy could be too inflationary. The latter would imply a rise in longer-dated supply, which of course, would exacerbate the moves we’ve seen thus far.
- In our minds, we feel that the second reason is the most likely. That makes sense considering that the U.S. fiscal deficit remains at historic levels (outside of war time), and there’s little that the incoming Trump administration can do to curb deficit and extend the 2018 tax cuts at the same time (which remains central to Trump’s agenda).
- As such, we’re concentrating most of the risk in this portfolio towards Canada while paying some tribute to the fact that U.S. Duration3 has sold off quite aggressively already.
- For the latter, we’ve done this via an allocation to the BMO Long-Term US Treasury Bond Index ETF (Ticker: ZTL)– which we feel could benefit from a tactical rally if it becomes clear that the market is reading the Fed wrong and long-term Fed policy expectations need to revalue lower. Indeed, this could happen if we see signs that economic momentum is slowing and/or if markets trip due to the elevated levels for yields.
- In Canada, we have reduced BMO Aggregate Bond Index ETF (Ticker: ZAG) to curb the number of positions in the portfolio that track the same theme (we are maintaining our weight for the BMO Discount Bond Index ETF (Ticker: ZDB). We are a bit concerned with how ‘rich’ Government of Canada (GoC) bonds are trading relative to the U.S., so our preference remains to be long instruments that track spread products.4
- We still envisage the BoC cutting rates a few more times – but we feel this theme may be better felt in tighter spreads for corporates and provincial bonds going forward.
Chart 1 – U.S. 10-year yields have behaved atypically this easing cycle
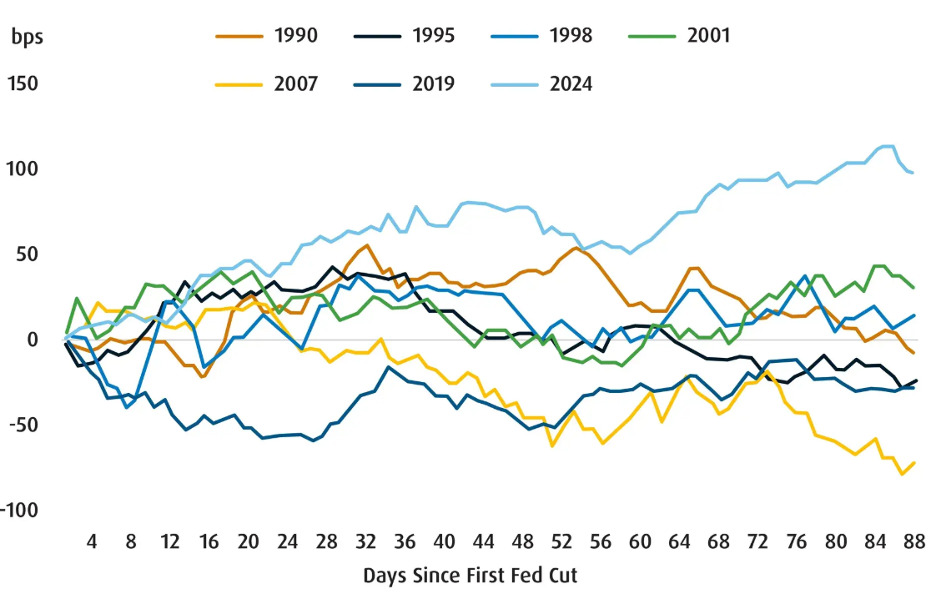
Source: BMO Global Asset Management.
Chart 2 – The U.S. 10-year term premium has risen aggressively over the past several months
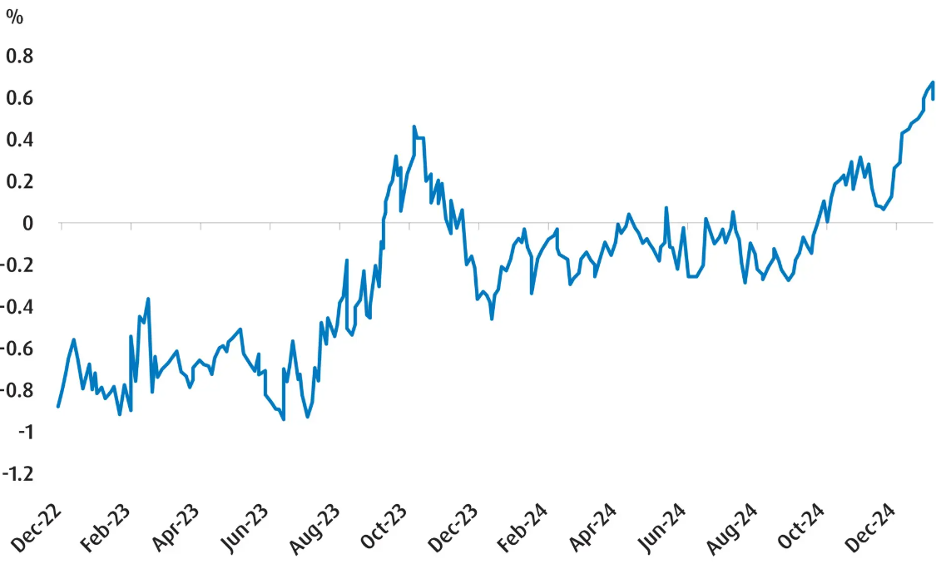
Source: BMO Global Asset Management.
Credit
- Broad corporate credit spreads5 spent the better part of Q4 2024 at tighter levels relative to earlier in that year. However, there has been some volatility6 of late due to gyrations in benchmark yields.
- While Canadian dollar (CAD) credit still offers reasonably attractive yields, we’re a bit circumspect on broad corporates going forward given spreads are now at fairly tight levels. Indeed, we estimate that an 18-20 bps backup could wipe out the carry over the benchmark. While that isn’t the base case, we can’t say it’s impossible given the still patchy backdrop for the Canadian economy.
- As such, our preference is to remain focused on the BMO Laddered Preferred Share Index ETF (Ticker: ZPR)– where we are increasing the weight to 20% – as well as the BMO Canadian Bank Income Index ETF (Ticker: ZBI). We like banks as a sector, and prefer the low volatility profile for an instrument like ZBI.
- Additionally, the Bank of Canada has announced that it will end its quantitative tightening, or QT, efforts in the first half of this year. Beyond that, there will be a reliance on 1-and 3-month-term repos to address balance sheet management. We expect usage of provincial bonds as collateral for that program – which means there could be more room for provincial spreads to tighten from here. Given this, we’re allocating some risk towards the BMO Short Provincial Bond Index ETF (Ticker: ZPS).
Currency
- Admittedly, there is a lot of uncertainty ahead for USD/CAD. We’re writing this publication a week before President-elect Trump is scheduled to take the oath of office, but there is a sense now that tariffs on Canadian exports are all but certain at this point. In theory, this should lead to further upside for USD/CAD in the coming months.
- But in practice, we sense that markets have already positioned for this reality. Indeed, positioning in futures implies that markets are very long USD/CAD already, which tells us that the risk/reward of Trump’s announcement skews the risk to the downside potentially. That could come from a change relative to expectations (perhaps Canada does get a carve out, or the level of tariffs start out at 5% instead of 25%).
- A scenario like that could lead investors to rush towards closing short USD/CAD positions. For the coming quarter, our projected range for USD/CAD is 1.42–1.45.
Fixed Income model portfolio
| Ticker | Name | Weight | Duration | Weighted avg. YTM* | Management fee | Exposure | Positioning |
| ZDB | BMO Discount Bond Index ETF | 25.0% | 7.25 | 3.47% | 0.09% | Canada | Core |
| ZPR | BMO Laddered Preferred Share Index ETF | 20.0% | 3.05 | 6.65% | 0.45% | Canada | Core |
| ZBI | BMO Canadian Bank Income Index ETF | 25.0% | 2.17 | 4.18% | 0.25% | Canada | Core |
| ZTL | BMO Long Term US Treasury Bond Index ETF | 15.0% | 16.33 | 4.87% | 0.20% | United States | Non-traditional |
| ZPS | BMO Short Provincial Bond Index ETF | 15.0% | 2.91 | 3.08% | 0.25% | Canada | Non-traditional |
BMO Global Asset Management. For illustrative purposes only. The information contained herein is not, and should not be construed as, investment, tax or legal advice to any party. These are not recommendations to buy or sell any particular security. Particular investments and/or trading strategies should be evaluated relative to the individual’s risk profile and investment objectives. Professional advice should be obtained with respect to any circumstance.
* Weighted Average Yield to Maturity: The market value-weighted average yield to maturity includes coupon payments and any capital gain or loss that the investor will realize by holding the bonds to maturity.
Source: Bloomberg, BMO Asset Management Inc., as of December 31, 2024.
Fund performance (%)
| Ticker | Year-to-date | 1-month | 3-month | 6-month | 1-year | 3-year | 5-year | 10-year | Since inception |
| ZDB | 4.13 | -0.65 | -0.14 | 4.55 | 4.13 | -0.77 | 0.78 | 1.86 | 2.27 |
| ZPR | 26.65 | 2.74 | 4.85 | 9.69 | 26.65 | 3.83 | 7.95 | 2.81 | 2.45 |
| ZBI | 11.94 | 0.60 | 1.97 | 5.14 | 11.94 | – | – | – | 3.72 |
| ZTL | -0.20 | -3.70 | -3.79 | 2.63 | -0.20 | -9.64 | -4.33 | – | 0.72 |
| ZPS | 5.01 | 0.32 | 0.36 | 3.94 | 5.01 | 1.59 | 1.67 | 1.58 | 2.01 |
As of December 31, 2024. Inception dates for ZDB = February 10, 2014, ZPR = November 14, 2012, ZBI = February 7, 2022, ZTL = February 21, 2017, ZPS = October 20, 2009.
Credit summary

Credit quality summary of model fixed income portfolio. Ratings are composite scoring from various ratings agencies for the underlying securities. BMO Global Asset Management. Bloomberg, December 31, 2024.
Term summary

Term summary showing breakdown of average duration of model portfolio securities. BMO Global Asset Management, Bloomberg, as of December 31, 2024.
| Ticker | Allocation |
| ZDB | Keep at 25% |
| ZPR | Up to 20% |
| ZBI | Increase to 25% |
| ZTL | Increase to 15% |
| ZPS | Increase to 15% |


")


