


North American markets have experienced substantial pressure amid ongoing tariff policy shifts. The S&P 500 and TSX indices have seen pronounced declines, led by large cap Technology stocks, while the Canadian dollar (CAD) has weakened against the U.S. currency (USD).
Market participants are reacting to the Trump administration’s economic agenda built in part around the relocation of businesses to the U.S., via tariff policies on trading partner countries. As part of this agenda, the administration appears willing to accept the risk of recession and higher inflation, and it is uncertain at what point U.S. market weakness may alter this view.
Here are three defensive BMO ETF strategies to help insulate portfolios from potential volatility ahead:
1. BMO Low Volatility ETFs
BMO Low Volatility ETFs has acted as a steady port of call amid recent storms of uncertainty by losing less on the market’s downswings while participating in the upswings. Low volatility stocks’ stable cash flows provided a hedge against market uncertainties, while their relative valuations remain attractive. As the market rotates toward more defensive positions, low volatility strategies are well-positioned, giving investors the confidence to stay the course during turbulent periods and remain invested over the long term.
Year-to-Date Positioning & Performance
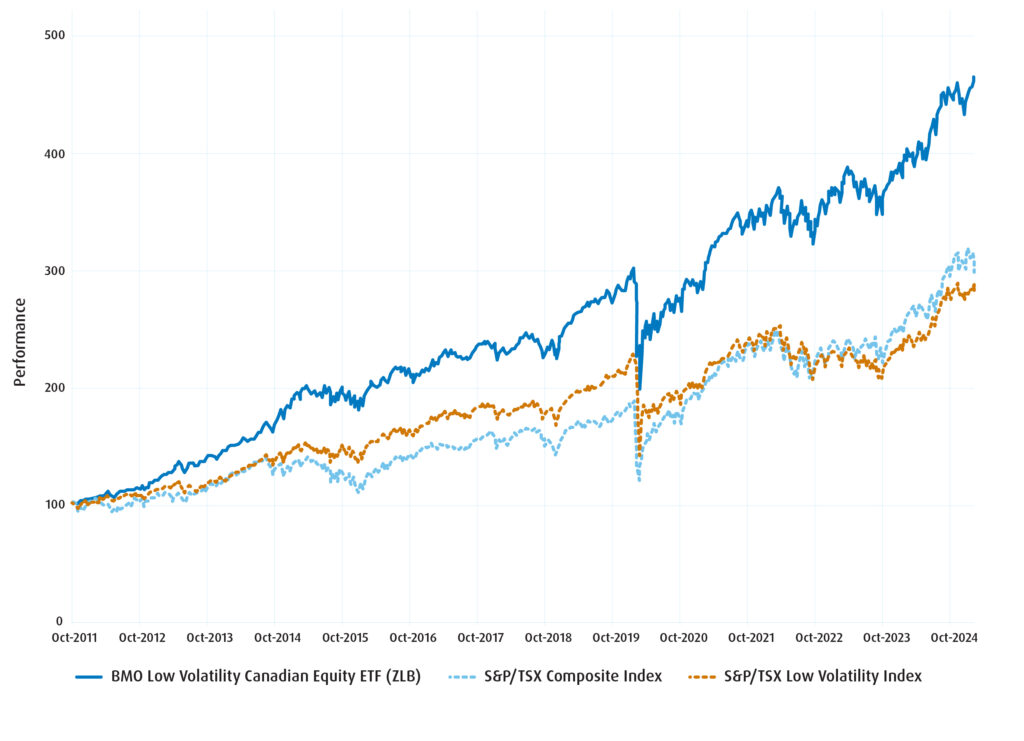
BMO Low Volatility Canadian Equity ETF (Ticker: ZLB)
An overweight in communication services (+7.72%) added value. Underweighting high beta sectors such as Financials (-4.52%) and Information Technology (-6.63%) and no weight in the Energy (-3.47%) sectors contributed to performance.1
ZLB Since Inception Returns
| Net Returns (10/26/2011 – 3/11/2025) |
Year-to -Date |
1-Year | 3-Year | 5-Year | 10-Year | Since Inception |
Since Inception Volatility |
Since Inception Sharpe Ratio |
| BMO Low Volatility Canadian Equity ETF |
3.05% | 13.73% | 8.12% | 4.80% | 18.97% | 12.01% | 11.43 | 1.05 |
| S&P/TSX Low Volatility Total Return Index |
1.33% | 16.45% | 4.39% | 2.61% | 14.06% | 8.59% | 12.00 | 0.72 |
| S&P/TSX Composite Total Return Index |
-1.49% | 14.78% | 7.48% | 4.42% | 17.40% | 8.51% | 14.30 | 0.60 |
Source: Bloomberg, March, 11 2025.
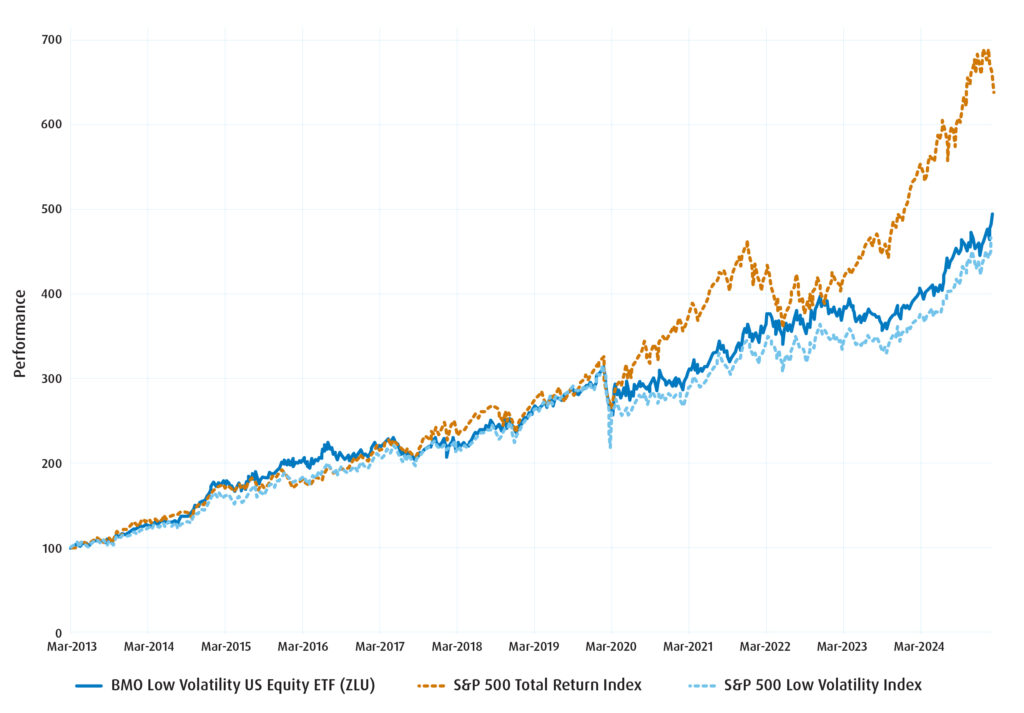
BMO Low Volatility US Equity ETF (Ticker: ZLU)
- Underweight in the riskier Information Technology (-11.6%) and Consumer Discretionary (-14.0%) sectors, as well as our overweight in stable sectors such as Utilities (+2.6%), Consumer Staples (+4.6%), and Health Care (+6.5%), added value.1
ZLU Since Inception Returns
| Net Returns (3/26/2013 – 3/11/2025) |
Year-to -Date |
1-Year | 3-Year | 5-Year | 10-Year | Since Inception |
Since Inception Volatiility |
Since Inception Sharpe Ratio |
| BMO Low Volatility US Equity ETF CAD Units |
6.12% | 21.54% | 11.14% | 6.54% | 22.42% | 14.01% | 13.70 | 1.02 |
| S&P 500 Low Volatility Total Return Index |
5.12% | 23.10% | 12.08% | 7.08% | 22.90% | 13.45% | 14.60 | 0.92 |
| S&P 500 CAD Total Return Index |
-4.48% | 18.34% | 16.49% | 9.59% | 29.69% | 16.66% | 16.99 | 0.98 |
Source: Bloomberg, March 11, 2025.
2. BMO Long Short ETFs
The BMO long-short strategies seek to provide lower volatility and equity-like returns over a complete market cycle. Since launch, the monthly volatility of BMO Long Short Canadian Equity (Ticker: ZLSC) and BMO Long Short US Equity ETF (Ticker: ZLSU) have been 6% and 6.8%, respectively, much lower than the volatility of the broad benchmarks of 11.2% and 9.2%.1
The ETF maintains exposure to higher-quality stocks while short-selling lower-quality stocks that are expected to underperform. The shorts hedge market risk and add a source of returns. The portfolios sector and single stock exposures are tightly risk-controlled.
Year-to-Date Positioning and Performance
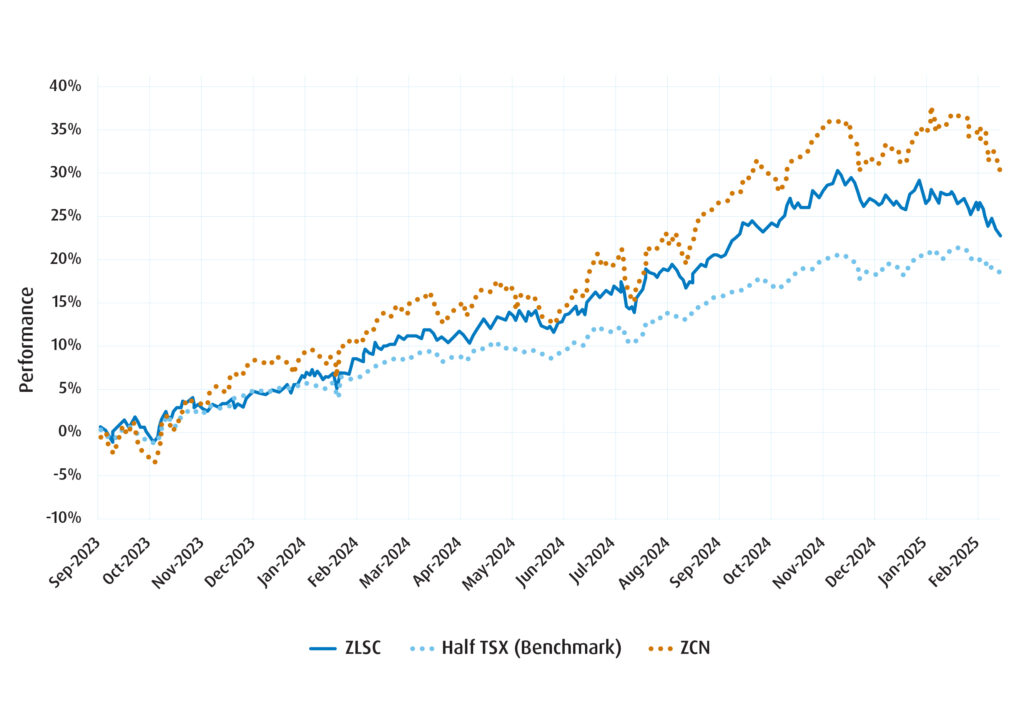
BMO Long Short Canadian Equity ETF (Ticker: ZLSC)
ZLSC benefitted from stock selection in Materials and long gold positions in Agnico Eagle Mines (+24.4%), Lundin Gold (+30%), and Alamos Gold (+24.7%). And shorting among companies which could not control costs or efficiently manage production, e.g. in Eldorado Gold (short, -6.9%).1
ZLSC Since Inception Returns
| Net Returns (9/26/2023 – 3/11/2025) | Month-to-Date | Year-to-Date | 1-Year | Since Inception (Annualized) |
| ZLSC | -2.93% | -2.89% | 11.70% | 15.09% |
| TSX Composite (ZCN) | -4.41% | -1.50% | 14.36% | 19.43% |
| 50% TSX Benchmark | -2.15% | -0.40% | 9.47% | 12.04% |
Source: Bloomberg, March 11, 2025.
BMO Long Short US Equity ETF (Ticker: ZLSU)
- ZLSU added value due to stock selection in Healthcare, Gilead long (+24.5%), United Health short (-5.6%). Industrials, General Electric (+24.8%), Uber (+26.8%) and Consumer Discretionary (not owning Tesla -27.0%), partially offset by Information Technology (Broadcom long -13.5%, Intel short +19.0%).1
| Net Returns (9/26/2023 – 3/11/2025) | Month-to-Date | Year-to-Date | 1-Year | Since Inception (Annualized) |
| ZLSU | -4.46% | 0.24% | 22.49% | 26.27% |
| S&P 500 (ZSP) | -6.77% | -4.86% | 16.18% | 26.70% |
| 50% S&P 500 Benchmark | -3.50% | -1.88% | 14.59% | 18.48% |
Source: Bloomberg, March, 11 2025.
3. BMO Buffer ETFs
For risk averse investors seeking to hedge some potential downside risk and maintain their equity exposure, BMO’s Buffer ETFs series provides a cushion against the first -15% (before fees, expenses and taxes) decrease in the Reference Index over a period of approximately one year, starting from the first business day of the stated outcome period while still participating in potential upside, up to cap of 8.10% (before fees, expenses and taxes). So, if the market is down 15%, it is only after a breach of the buffer that any loss would be incurred. BMO US Equity Buffer Hedged to CAD ETF – January (Ticker: ZJAN) owns the stocks in the S&P 500 as the underlying reference asset, while investors collect dividends on top of the 8.10% cap.
Given the recent market sell off, as of close of March 10, 2025, ZJAN’s upside potential (remaining cap) has improved to 10.28%. If you were to include the dividends on top on this, it brings the potential maximum total return to over 11% for the remaining outcome period.
Buffer ETFs: Downside Protection, Upside Participation
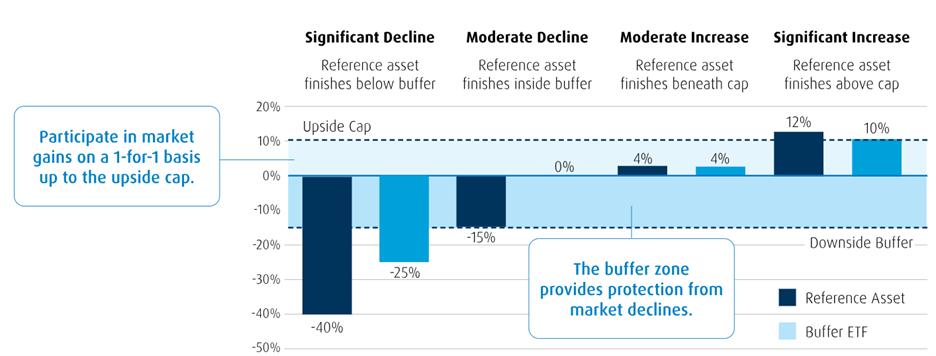
For illustrative purposes only, using 10% as an example only. BMO Global Asset Management.
Performance (%)
| Year-to-Date | 1-Month | 3-Month | 6-Month | 1-Year | 3-Year | 5-Year | 10-Year | Since Inception | |
| ZLB | 4.50 | 2.93 | 1.70 | 5.86 | 17.50 | 10.04 | 10.88 | 9.00 | 12.11 |
| ZLU | 7.33 | 3.45 | 3.44 | 10.69 | 24.55 | 11.90 | 11.64 | 10.78 | 14.25 |
| ZLSC | 0.04 | -0.84 | -1.64 | 5.99 | 17.00 | – | – | – | 18.13 |
| ZLSU | 4.92 | 0.51 | 7.65 | 17.30 | 28.08 | – | – | – | 31.13 |
| ZJAN | 0.85 | -0.39 | 1.42 | 3.20 | 8.72 | – | – | – | 10.07 |
Bloomberg, as of February 28, 2025. Inception date for ZLB = October 21, 2011, ZLU = March 19, 2013, ZLSC, ZLSU = September 27, 2023, ZJAN = January 24, 2024
Sharpe Ratio: A risk-adjusted return measure calculated by using standard deviation and excess return to determine reward per unit of risk. The higher the Sharpe Ratio, the better the portfolio’s historical risk-adjusted performance.
Volatility: Measures how much the price of a security, derivative, or index fluctuates. The most commonly used measure of volatility when it comes to investment funds is standard deviation.
Disclaimers
The portfolio holdings are subject to change without notice. They are not recommendations to buy or sell any particular security.
Distribution yields are calculated by using the most recent regular distribution, or expected distribution, (which may be based on income, dividends, return of capital, and option premiums, as applicable) and excluding additional year end distributions, and special reinvested distributions annualized for frequency, divided by current net asset value (NAV). The yield calculation does not include reinvested distributions.
Distributions are not guaranteed, may fluctuate and are subject to change and/or elimination. Distribution rates may change without notice (up or down) depending on market conditions and NAV fluctuations.
The payment of distributions should not be confused with the BMO ETF’s performance, rate of return or yield. If distributions paid by a BMO ETF are greater than the performance of the investment fund, your original investment will shrink. Distributions paid as a result of capital gains realized by a BMO ETF, and income and dividends earned by a BMO ETF, are taxable in your hands in the year they are paid.
Your adjusted cost base will be reduced by the amount of any returns of capital. If your adjusted cost base goes below zero, you will have to pay capital gains tax on the amount below zero.
Cash distributions, if any, on units of a BMO ETF (other than accumulating units or units subject to a distribution reinvestment plan) are expected to be paid primarily out of dividends or distributions, and other income or gains, received by the BMO ETF less the expenses of the BMO ETF, but may also consist of non-taxable amounts including returns of capital, which may be paid in the manager’s sole discretion. To the extent that the expenses of a BMO ETF exceed the income generated by such BMO ETF in any given month, quarter, or year, as the case may be, it is not expected that a monthly, quarterly, or annual distribution will be paid. Distributions, if any, in respect of the accumulating units of BMO Short Corporate Bond Index ETF, BMO Short Federal Bond Index ETF, BMO Short Provincial Bond Index ETF, BMO Ultra Short-Term Bond ETF and BMO Ultra Short-Term US Bond ETF will be automatically reinvested in additional accumulating units of the applicable BMO ETF. Following each distribution, the number of accumulating units of the applicable BMO ETF will be immediately consolidated so that the number of outstanding accumulating units of the applicable BMO ETF will be the same as the number of outstanding accumulating units before the distribution. Non-resident unitholders may have the number of securities reduced due to withholding tax. Certain BMO ETFs have adopted a distribution reinvestment plan, which provides that a unitholder may elect to automatically reinvest all cash distributions paid on units held by that unitholder in additional units of the applicable BMO ETF in accordance with the terms of the distribution reinvestment plan. For further information, see the distribution policy in the BMO ETFs’ simplified prospectus.
Past Performance is not indicative of future results.
The viewpoints expressed by the author represents their assessment of the markets at the time of publication. Those views are subject to change without notice at any time. The information provided herein does not constitute a solicitation of an offer to buy, or an offer to sell securities nor should the information be relied upon as investment advice. Past performance is no guarantee of future results. This communication is intended for informational purposes only.
All investments involve risk. The value of an ETF can go down as well as up and you could lose money. The risk of an ETF is rated based on the volatility of the ETF’s returns using the standardized risk classification methodology mandated by the Canadian Securities Administrators. Historical volatility doesn’t tell you how volatile an ETF will be in the future. An ETF with a risk rating of “low” can still lose money. For more information about the risk rating and specific risks that can affect an ETF’s returns, see the BMO ETFs’ simplified prospectus.
This article is for information purposes only. The information contained herein is not, and should not be construed as investment, tax or legal advice to any party. Particular investments and/or trading strategies should be evaluated and professional advice should be obtained with respect to any circumstance.
An investor that purchases Units of a Structured Outcome ETF other than on the first day of a Target Outcome Period and/or sells Units of a Structured Outcome ETF prior to the end of a Target Outcome Period may experience results that are very different from the target outcomes sought by the Structured Outcome ETF for that Target Outcome Period. Both the cap and, where applicable, the buffer are fixed levels that are calculated in relation to the market price of the applicable Reference ETF and a Structured Outcome ETF’s NAV (as Structured herein) at the start of each Target Outcome Period. As the market price of the applicable Reference ETF and the Structured Outcome ETF’s NAV will change over the Target Outcome Period, an investor acquiring Units of a Structured Outcome ETF after the start of a Target Outcome Period will likely have a different return potential than an investor who purchased Units of a Structured Outcome ETF at the start of the Target Outcome Period. This is because while the cap and, as applicable, the buffer for the Target Outcome Period are fixed levels that remain constant throughout the Target Outcome Period, an investor purchasing Units of a Structured Outcome ETF at market value during the Target Outcome Period likely purchase Units of a Structured Outcome ETF at a market price that is different from the Structured Outcome ETF’s NAV at the start of the Target Outcome Period (i.e., the NAV that the cap and, as applicable, the buffer reference). In addition, the market price of the applicable Reference ETF is likely to be different from the price of that Reference ETF at the start of the Target Outcome Period. To achieve the intended target outcomes sought by a Structured Outcome ETF for a Target Outcome Period, an investor must hold Units of the Structured Outcome ETF for that entire Target Outcome Period.
BMO Buffer ETFs seeks to provide income and appreciation that match the return of a Reference Index up to a cap (before fees, expenses and taxes), while providing a buffer against the first 15% (before fees, expenses and taxes) of a decrease in the Reference Index over a period of approximately one year, starting from the first business day of the stated outcome period.
Commissions, management fees and expenses all may be associated with investments in exchange traded funds. Please read the ETF Facts or simplified prospectus of the BMO ETFs before investing. The indicated rates of return are the historical annual compounded total returns including changes in unit value and reinvestment of all dividends or distributions and do not take into account sales, redemption, distribution or optional charges or income taxes payable by any unitholder that would have reduced returns. Exchange traded funds are not guaranteed, their values change frequently and past performance may not be repeated.
For a summary of the risks of an investment in the BMO ETFs, please see the specific risks set out in the BMO ETF’s simplified prospectus. BMO ETFs trade like stocks, fluctuate in market value and may trade at a discount to their net asset value, which may increase the risk of loss. Distributions are not guaranteed and are subject to change and/or elimination.
BMO ETFs are managed by BMO Asset Management Inc., which is an investment fund manager and a portfolio manager, and a separate legal entity from Bank of Montreal.
BMO Global Asset Management is a brand name under which BMO Asset Management Inc. and BMO Investments Inc. operate.
“BMO (M-bar roundel symbol)” is a registered trademark of Bank of Montreal, used under licence.


")


