

Summary
- Set clear goals and know your risk tolerance.
- Pick the right account and identify suitable investments.
- Invest consistently and rebalance periodically.
It’s easier than you think
Investing can feel intimidating, but it doesn’t have to be. Like training at the gym or picking up a new skill, success isn’t about getting everything perfect, it’s about showing up with a plan.
Success isn’t about timing the market or chasing hot stocks or ETFs. A strategy built on clear goals, research, and consistency drives long-term growth.
And the best part? A winning investment plan runs in the background. Once set up, your portfolio can compound over time and grow on autopilot with only occasional check-ins.
Setting goals: Think like an athlete
To stick with our fitness analogy, setting clear goals is key to success. Are you aiming for long-term capital growth, steady cash flow, or a mix of both? Or perhaps less volatility in your portfolio (minimizing the ups and downs)?
Your goal shapes your investment choices, including how much risk you’re willing to take and when you’ll need the money. Here’s how financial goals can be categorized:
- Short-term (0-3 years): Building an emergency fund or saving for a dream holiday.
- Medium-term (3-5 years): Buying a first home.
- Long-term (10+ years): Building wealth for financial independence.
Understanding risk: How much volatility can you handle?
Every investment journey has highs and lows, just like life. Some days, you make great progress; other days, even the basics feel challenging. Markets follow a similar path, with inevitable ups and downs along the way.
Stocks, as reflected in the BMO S&P 500 Index ETF (ZSP)1, experience downturns that can feel overwhelming to some, especially amid negative headlines. However, history shows that markets recover over time as economies heal, businesses grow profits, and investor confidence returns.
Chart 1 – Performance of S&P 500 over time
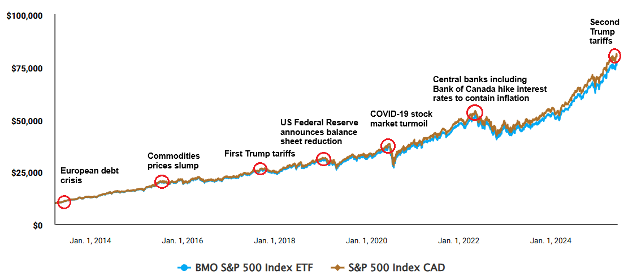 Source: BMO Global Asset Management, as of January 31, 20252. Performance in Canadian dollars. Past performance is not indicative of future returns.
If you have a long time horizon, you may be willing to hold more growth assets knowing you can ride out the volatility. If you’re planning a trip to Europe soon, a more conservative approach for some or all of your portfolio may be a better choice.
This ensures you’re not forced to sell investments at a loss due to short-term market dips, and that the various parts of your portfolio are working towards specific goals.
Strategic asset allocation: The nutrition plan for your portfolio
Strategic asset allocation (SAA) is like a well-balanced diet. It determines how your money is divided among different asset classes, each serving a unique purpose. Stocks fuel growth while fixed income adds stability, keeping your portfolio strong and resilient.
BMO’s asset allocation ETFs offer a helpful reference for structuring a portfolio into different risk profiles, but your allocation should align with your financial goals and risk tolerance.
Chart 2 – Asset Allocation targets of BMO asset allocation ETFs
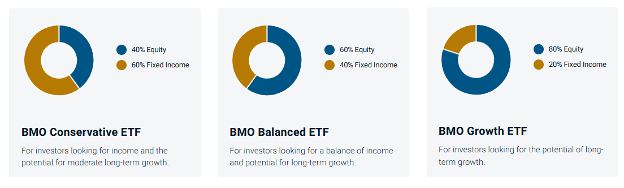
Source: BMO Global Asset Management. The portfolio holdings are subject to change without notice and only represent a small percentage of portfolio holdings. They are not recommendations to buy or sell any particular security.
After deciding on your mix of growth and defensive assets, the next step is diversifying across markets to reduce risk. For example, a growth investor’s underlying SAA targets might look like this:
- 80% in growth assets – with 40% in Canadian stocks, 25% in U.S. stocks, and 10% in other developed markets and 5% in emerging markets.
- 20% in defensive assets – including 15% in a mix of diversified Canadian bonds and 5% in short-term bonds or money market ETFs for added stability.
Picking the right structure and trading platform
Picking the right investment account can make a big difference in how your money grows. In Canada, popular options include:
- TFSA (Tax-Free Savings Account): Ideal for general investing – your money grows and can be withdrawn tax-free. Great for long-term investing and short-term saving.
- RRSP (Registered Retirement Savings Plan): Contributions lower your taxable income, and investments grow tax-deferred until withdrawal. Best for long-term retirement savings.
- Non-registered (taxable) account: No tax advantages, but no limits on contributions or withdrawals. Useful once you’ve maxed out registered accounts.
After choosing an account, the next step is selecting a trading platform. BMO InvestorLine offers registered and non-registered accounts, over 100 commission-free ETFs, and competitive pricing for stocks, along with tools and education to help you invest confidently.
Identifying suitable investments
The next step is selecting specific investments to implement your SAA. Common options include:
- ETFs: Diversified funds that track entire markets or sectors, offering broad exposure at a lower cost than actively managed funds.
- Stocks: Individual companies that offer high return or income potential but require ongoing research and monitoring.
- Bonds: Fixed-income investments designed to provide stability and potential income with modest risk relative to cash.
- Cash: Includes savings accounts and Guaranteed Investment Certificates designed to earn interest.
- Mutual Funds: Actively managed investment products, often with higher fees than ETFs.
For a hassle-free long-term strategy, ETFs offer instant diversification and broad market access in a single trade – without the complexity, costs and risks of managing individual stocks and bonds.
For example, investing in a mix of BMO S&P/TSX Capped Composite Index ETF (ZCN)3, BMO MSCI All Country World High Quality Index ETF (ZGQ)4, and BMO Aggregate Bond Index ETF (ZAG)5 provides broad exposure to over 2,000 Canadian stocks, bonds and global companies.
For those who prefer keeping it even simpler, funds like BMO Growth ETF Portfolio (ZGRO)6, BMO Balanced ETF Portfolio (ZBAL)7, and BMO Conservative ETF Portfolio (ZCON)8 provide an all-in-one solution at a low MER (management expense ratio).
As you gain confidence, you might explore adding commodities like gold or alternatives such as listed infrastructure for further diversification. These assets can help reduce correlations, meaning your investments won’t all move in the same direction at the same time.
Staying consistent: The power of regular investing
Investing, like any activity, requires consistency. Regular contributions smooth out market fluctuations and remove the stress of timing the market. Here’s how small, consistent investments can grow over time, assuming a 7% annualized return:
| Years invested | $50/month | $250/month | $500/month |
| 5 years | $3,580 | $17,900 | $35,799 |
| 10 years | $8,601 | $43,005 | $86,009 |
| 15 years | $15,643 | $78,216 | $156,432 |
| 20 years | $25,520 | $127,602 | $255,203 |
| 25 years | $39,373 | $196,867 | $393,735 |
Source: BMO Global Asset Management. Assumes a 7% annualized return. For illustrative purposes only; actual returns may vary and calculations do not account for taxes or fees. The information contained herein is not, and should not be construed as, investment, tax or legal advice to any party.
Keeping your portfolio on track: The importance of rebalancing
If you’re not using an asset allocation ETF with automatic rebalancing, you’ll need to monitor and periodically adjust your portfolio to keep it aligned with your SAA targets. Over time, some investments will grow faster than others, causing your allocation to shift.
Rebalancing keeps your portfolio aligned by selling overweight assets and reinvesting or adding funds to underweighted ones. Setting a quarterly, semiannual, or annual rebalancing schedule is a great way to keep your SAA in check. If you plan to do it yourself, make sure you’re keeping your emotions out of it and stick to your plan.
Just like a well-diversified portfolio reduces risk, rebalancing—combined with disciplined investing and low-cost diversification—keeps your portfolio strong while driving real progress toward your financial goals.
Volatility: Measures how much the price of a security, derivative, or index fluctuates. The most commonly used measure of volatility when it comes to investment funds is standard deviation.
Standard Deviation: A measure of risk in terms of the volatility of returns. It represents the historical level of volatility in returns over set periods. A lower standard deviation means the returns have historically been less volatile and vice-versa. Historical volatility may not be indicative of future volatility.
Sources:
- BMO S&P 500 Index ETF CAD (ZSP) as of January 31, 2025, YTD 3.90%, 1Y 36.21%, 2Y 28.70%, 3Y 16.63%, 5Y 16.96%, 10Y 14.87%, SI 18.20%, Inception Date Nov 14, 2012.
- https://df.bmogam.com/assets/static/etf-profiles-pdfs/BMO%20S%26P%20500%20Index%20ETF_Factsheet_EN_ZSP.pdf
- BMO S&P/TSX Capped Composite Index ETF (ZCN) as of January 31, 2025: YTD 3.47%, 1Y 25.07%, 2Y 14.36%, 3Y 9.91%, 5Y 11.42%, 10Y 8.94% SI 8.53%, Inception Date May 29, 2009.
- BMO MSCI All Country World High Quality Index ETF (ZGQ) as of January 31, 2025, YTD 4.77%, 1Y 30.00%, 2Y 28.79%, 3Y 15.04%, 5Y 15.60%, 10Y 4.12%, SI 14.96%, Inception date of Nov 5, 2014.
- BMO Aggregate Bond Index ETF (ZAG) as of January 31, 2025, YTD 1.20%, 1Y 6.89%, 2Y 4.44%, 3Y 0.90%, 5Y 0.36%, 10Y 1.51%, SI 2.91%, Inception Date Jan 19, 2010.
- BMO Growth ETF (ZGRO) as of January 31, 2025, YTD 3.48%, 1Y 23.52%, 2Y 16.49%, 3Y 9.71%, 5Y 9.97%, SI 10.60%, Inception Date of Feb 12, 2019.
- BMO Balanced ETF Portfolio (ZBAL) as of January 31, 2025, YTD 2.85%, 1Y 18.67%, 2Y 13.10%, 3Y 7.25%, 5Y 7.42%, SI 8.26%, Inception date of Feb 12, 2019.
- BMO Conservative ETF Portfolio (ZCON) as of January 31, 2025, YTD 2.22%, 1Y 13.94%, 2Y 9.74%, 3Y 4.79%, 5Y 4.87%, SI 5.92%, Inception Date of Feb 12, 2019.
Disclaimers
The portfolio holdings are subject to change without notice and only represent a small percentage of portfolio holdings. They are not recommendations to buy or sell any particular security.
Management Expense Ratios (MERs) are the audited MERs as of the fund’s fiscal year end. MER might not be displayed if the fund is less than one year old since the audited MER of the fund has not gone through a financial reporting period.
Index returns do not reflect transactions costs or the deduction of other fees and expenses and it is not possible to invest directly in an Index. Past performance is not indicative of future results.
The viewpoints expressed by the author represents their assessment of the markets at the time of publication. Those views are subject to change without notice at any time. The information provided herein does not constitute a solicitation of an offer to buy, or an offer to sell securities nor should the information be relied upon as investment advice. Past performance is no guarantee of future results. This communication is intended for informational purposes only.
All investments involve risk. The value of an ETF can go down as well as up and you could lose money. The risk of an ETF is rated based on the volatility of the ETF’s returns using the standardized risk classification methodology mandated by the Canadian Securities Administrators. Historical volatility doesn’t tell you how volatile an ETF will be in the future. An ETF with a risk rating of “low” can still lose money. For more information about the risk rating and specific risks that can affect an ETF’s returns, see the BMO ETFs’ simplified prospectus.
This article is for information purposes only. The information contained herein is not, and should not be construed as investment, tax or legal advice to any party. Particular investments and/or trading strategies should be evaluated and professional advice should be obtained with respect to any circumstance.
The ETF referred to herein is not sponsored, endorsed, or promoted by MSCI and MSCI bears no liability with respect to the ETF or any index on which such ETF is based. The ETF’s prospectus contains a more detailed description of the limited relationship MSCI has with the Manager and any related ETF.
This yield is calculated by taking the most recent regular distribution, or expected distribution, (excluding additional year end distributions) annualized for frequency, divided by current NAV. The yield calculation does not include reinvested distributions.
The Index is a product of S&P Dow Jones Indices LLC or its affiliates (“SPDJI”), and has been licensed for use by the Manager. S&P®, S&P 500®, US 500, The 500, iBoxx®, iTraxx® and CDX® are trademarks of S&P Global, Inc. or its affiliates (“S&P”) and Dow Jones® is a registered trademark of Dow Jones Trademark Holdings LLC (“Dow Jones”), and these trademarks have been licensed for use by SPDJI and sublicensed for certain purposes by the Manager. The ETF is not sponsored, endorsed, sold or promoted by SPDJI, Dow Jones, S&P, their respective affiliates, and none of such parties make any representation regarding the advisability of investing in such product(s) nor do they have any liability for any errors, omissions, or interruptions of the Index.
Commissions, management fees and expenses all may be associated with investments in exchange traded funds. Please read the ETF Facts or simplified prospectus of the BMO ETFs before investing. The indicated rates of return are the historical annual compounded total returns including changes in unit value and reinvestment of all dividends or distributions and do not take into account sales, redemption, distribution or optional charges or income taxes payable by any unitholder that would have reduced returns. Exchange traded funds are not guaranteed, their values change frequently and past performance may not be repeated.
For a summary of the risks of an investment in the BMO ETFs, please see the specific risks set out in the BMO ETF’s simplified prospectus. BMO ETFs trade like stocks, fluctuate in market value and may trade at a discount to their net asset value, which may increase the risk of loss. Distributions are not guaranteed and are subject to change and/or elimination.
BMO ETFs are managed by BMO Asset Management Inc., which is an investment fund manager and a portfolio manager, and a separate legal entity from Bank of Montreal.
BMO Global Asset Management is a brand name under which BMO Asset Management Inc. and BMO Investments Inc. operate.
“BMO (M-bar roundel symbol)” is a registered trademark of Bank of Montreal, used under licence.


")


