


Since the end of last year, our preferred gauge of the trade-weighted U.S. dollar (USD) has declined by several percent. This runs contrary to what you would normally expect as U.S. tariffs should (in theory) lead to a higher valuation for the dollar. However, theory doesn’t necessarily equate to practice – and the greenback’s decline speaks to a change in structural factors that we don’t see dissipating any time soon barring a substantial pivot in U.S. trade and foreign policy.
But before we delve into our rationale, we need to distinguish between the valuation of the U.S. dollar and its reserve currency status. What we are saying is that there is more room for the U.S. dollar to fall. We are not saying that the U.S. dollar will lose its reserve currency status. Instead, we are likely in the antechamber of a more balkanized world of reserve currencies, with the U.S. dollar remaining in the pole position.
Why the U.S. Dollar will Remain a ‘Reserve Currency’
There are two direct reasons for why the U.S. dollar is ubiquitous in global finance.
For one, the greenback provides a reliable store of value for international investors.1 True, we have seen a decline in the dollar’s share of global reserves over the past few decades, but at 57%, it’s still more than double the next higher allocation.2 That speaks volumes about the trust global central banks have in the stability of the dollar.
Second, the currency is still the most practical medium of exchange outside of the United States. Consider that 60% of the world’s exports are still invoiced in U.S. dollars. It’s predominant use in global trade means that the USD provides the benefit of network externalities that make the cost of doing business cheaper than utilizing other less liquid currencies. A South Korean apparel company will almost certainly source textiles from India using USD as payment instead of South Korean won (KRW) or Indian rupee (INR) for that reason.
Its utility as a medium of exchange also means that the U.S. dollar will remain the dominant currency in international banking. The U.S. Federal Reserve (Fed) has estimates that around 60% of foreign and international loans and deposits are denominated in USD. Also, the dollar makes up well over 60% of foreign currency debt globally.
To make this clearer, we’ve updated the Fed’s model for international usage of the USD. Chart 1 shows that even though the dollar’s share of international reserves is declining, its international usage is still rising. Chart 2 shows the current index for usage for the USD against other currencies.
Chart 1 – The USD’s Usage Outside of the U.S. Has Increased, Even as Reserves Have Declined
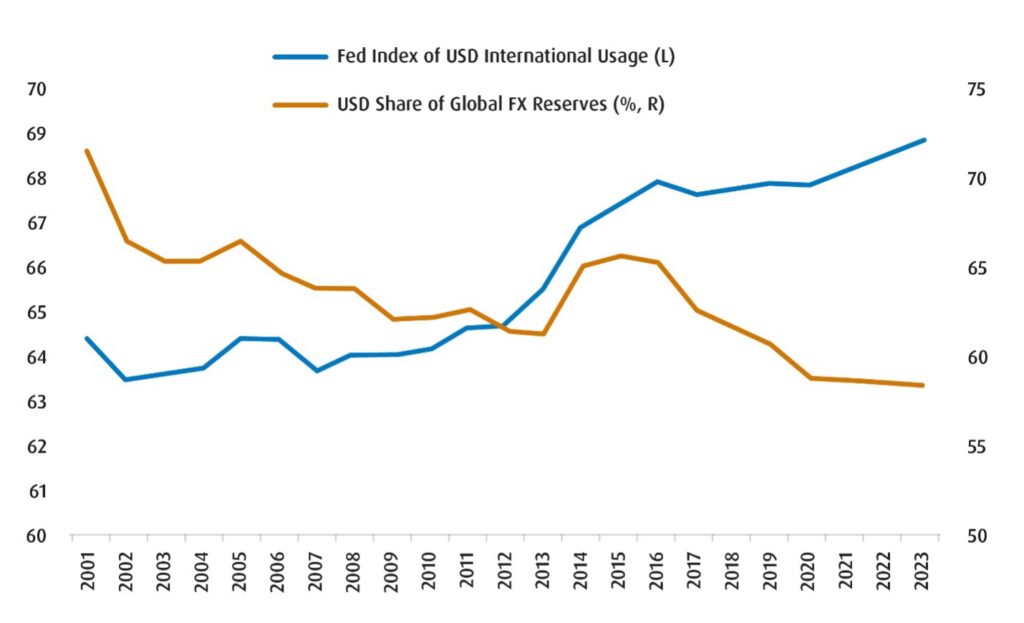
*Fed’s Index is constructed by applying weights of 25% for the U.S. dollar’s share of international reserves, foreign currency debt issuance, transactions and 12.5% for both international claims and liabilities. As of December 31, 2024.
Source: BMO GAM, BIS, IMF, Federal Reserve
Chart 2 – Current Index of International Usage by Currency
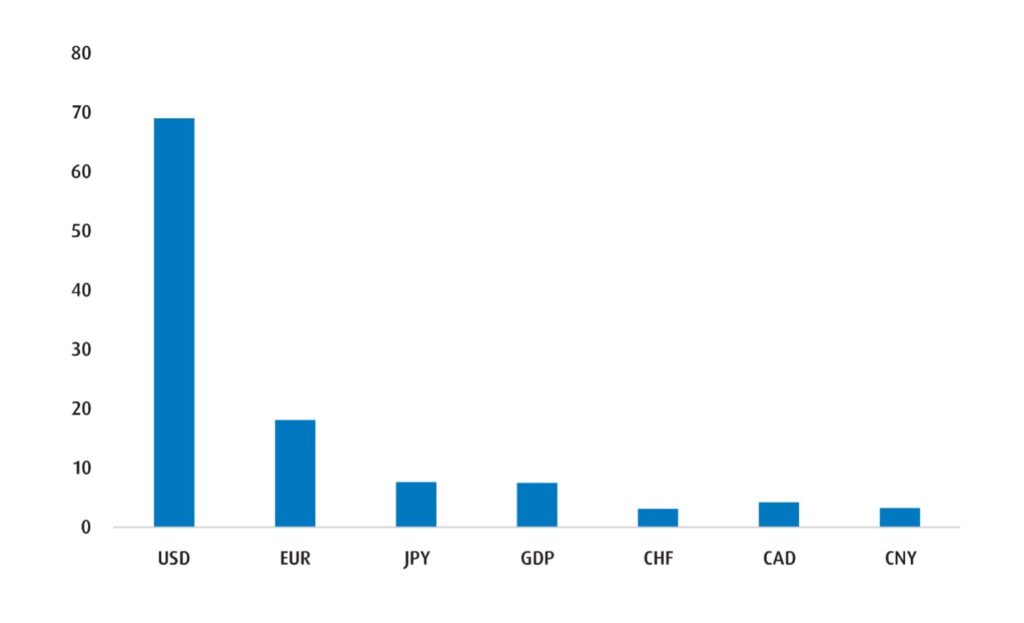
*Fed’s Index is constructed by applying weights of 25% for each currency’s share of international reserves, foreign currency debt issuance, transactions and 12.5% for both international claims and liabilities. As of December 31, 2024.
Source: BMO GAM, BIS, IMF, Federal Reserve
Indeed, even if the USD declines by an appreciable degree, it’s hard to envisage a scenario whereby the global financial system can wean itself off the dollar easily.
Why We Think the U.S. Dollar Will Still Lose Value Over the Long-Term
Over the past several decades, the strength of the dollar has been buttressed by foreign portfolio inflows. Naturally, this was driven by the outperformance of U.S. markets as well as higher yields relative to other countries with higher savings. In fact, continued foreign inflows into American assets is an important reason for why the U.S. Treasury can borrow at lower rates and why the U.S. runs a large external (or current account) deficit.
However, a continued slowing of foreign allocation to U.S. securities is likely to weigh further on the greenback from here. We can use simple balance of payments3 analysis to make our point. In 2024, the U.S. ran a current account deficit US$1.13 trillion which meant that foreign direct and portfolio investment into the U.S. would have needed to be at least that level with any residual likely made up of American sales of foreign assets.4 Since portfolio flow tends to be less sticky than direct investments, the adjustments tend to be quicker here – and any slowing of portfolio inflow to the U.S. would mean an imbalance. Barring any U.S. sales of foreign assets, or an adjustment of prices, the U.S. dollar would have to fall to balance things out.
We can illustrate this a bit more clearly. By taking the long-term relationship between foreign holdings of U.S. securities and changes in U.S. asset prices (the S&P 500 and US 10-year Treasury yields), we estimate the degree of decline in the trade-weighted USD due to portfolio shifts. The results of our analysis are displayed in Table 1. As an example, if the S&P 500 falls to 4,500 and US 10-year yields extend higher to 5.25% due to capital flight, then our model would estimate that the trade-weighted USD would fall by 12.7% from current levels (scenario 4 in Table 1).
Table 1 – Projecting the U.S. Dollar’s Decline if U.S. Equities and Bond Prices Continue to Fall
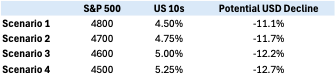
Source: BMO GAM. For illustrative purposes only.
Naturally, there are caveats to this type of analysis. The most obvious is that we are ascribing a linear relationship to flows – which tend to be more convex. Nevertheless, we are comfortable with the conclusion that further drops in U.S. assets should lead to additional portfolio outflows and a lower USD. Indeed, the relationship between portfolio flows and USD performance has held for decades now (Chart 3).
Chart 3 – The Relationship Between Foreign Portfolio Flows and the U.S. Dollar
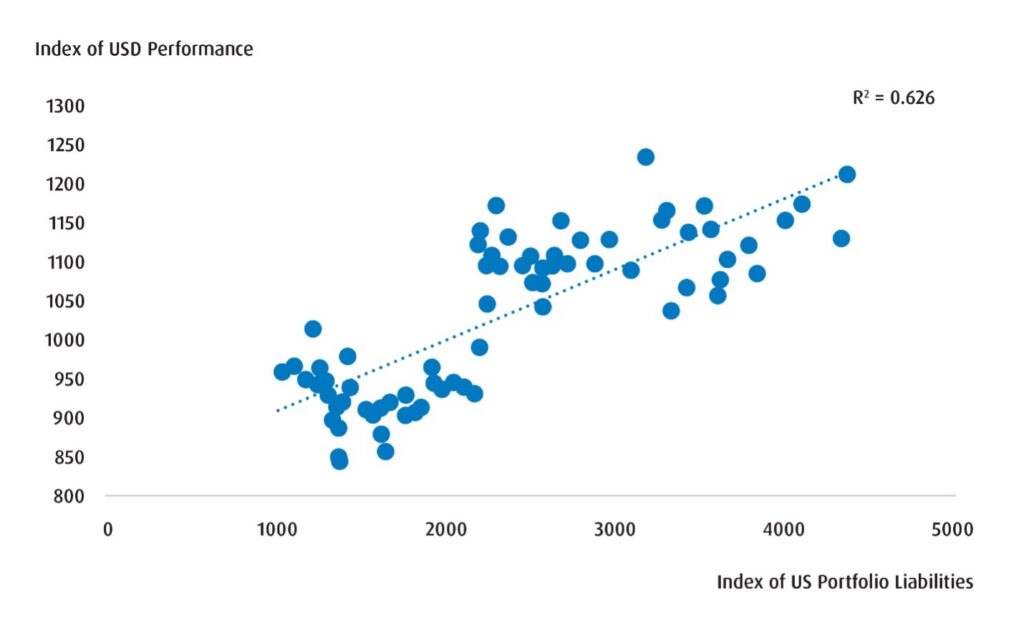 R2 (or R-squared) measures the explanatory power of the variable on the x-axis for the variable on the y-axis. A low number implies a weaker relationship, a high number implies a stronger relationship. As of March 31, 2025.
*Both the value of the USD and US portfolio liabilities are indexed to Q1 2006
**Quarterly observations
Source: IMF, BMO GAM
But it’s not only a decline in U.S. asset prices that we should worry about here. An increase in trade and capital barriers alongside a general erosion of trust in long-standing U.S. institutions is another important risk to a slowing in foreign portfolio inflows.
Why Trade and Capital Barriers Matter
Remember, it’s not a coincidence that the ubiquity of the dollar has come during a period when global trust in American institutions has been high. The United States has played a central role in shaping global finance in the decades after WWII. At the same time, the independence of the Fed has largely been considered sacrosanct, while U.S. markets have provided the necessary depth and liquidity needed to engender safe haven status.
But now? The United States has pivoted to a position of far more restrictiveness when it comes to international trade. The average effective tariff rate levied by the U.S. has jumped from 2-3% to north of 20% – which is the highest that it’s been since the Great Depression.5 Additionally, an average tariff rate north of 20% means that the U.S. is more protectionist than countries like Iran, Algeria and Sudan which are far less liberalized from an economic standpoint. Also, foreign policy has deviated materially from the norms over the past several decades, and the ‘rules-based’ global order has been upended.
Again, the above doesn’t necessarily portend an end to the greenback’s reserve status, but it’s easy to see an environment whereby the erosion of using the USD as a medium of exchange or a store of value will still lead to lower usage outside of the U.S. over time. For instance, a fall in USD international usage to 2001-2008 levels (see Chart 1) is possible and would be consistent with a weaker valuation for the greenback as well.
Takeaways
If we assume no material change in U.S. trade and foreign policy, then it’s reasonable to expect further outflows and/or a slowing of inflows that may certainly beget a continued fall in USD valuation.
What this means for our readers is that any tactical USD strength in the coming period provides opportunities to scale into strategic hedges for your U.S.-based investments.
We expect global asset managers to continue to prioritize regional diversification in the quarters ahead. This comes as the ‘American exceptionalism’ theme was already oversubscribed in the last few years and as supportive idiosyncratic factors have emerged outside of North America.
Indeed, we still see plenty of room to the upside for European equities – not least as German fiscal policy has shifted to be expansionary and as we continue to expect the euro (EUR) to outperform.
With that in mind, we are constructive on the following funds:
- BMO International Dividend ETF (ZDI)
- BMO Europe High Dividend Covered Call ETF (ZWP)
- BMO MSCI EAFE High Quality Index ETF (ZIQ)
Performance (%)
| YTD | 1 mo | 3 mos | 6 mos | 1 yr | 3 yr | 5 yr | 10 yr | Since inception | |
| ZDI | 9.76 | 0.69 | 9.76 | 5.74 | 13.42 | 13.79 | 14.60 | 6.64 | 7.26 |
| ZWP | 9.35 | -0.66 | 9.35 | 5.42 | 12.62 | 13.20 | 12.41 | – | 6.61 |
| ZIQ | Returns are not available as there is less than one year’s performance data. | ||||||||
Bloomberg, as of March 31, 2025. Inception date for ZDI = November 5, 2014, ZWP = March 2, 2018, ZIQ = October 24, 2024. Past performance is not a guide to future performance. Performance is shown net of fees, in the currency of the respective share class with dividends reinvested.
Footnotes
1 Greenback: colloquial term for the U.S. dollar.
2 BMO GAM/ Federal Reserve, as of March 2025.
3 Balance of payments: a record of all economic transactions between a country and the rest of the world over a specific period, typically a quarter or a year. It’s a comprehensive accounting statement that reflects the flow of goods, services, income, and capital between a country’s residents and non-residents.
4 International portfolio investment: Sometimes referred to as foreign portfolio investment (FPI), involves an investor acquiring financial assets in another country, such as stocks, bonds, and other securities.
5 The Smoot-Hawley Tariff Act of 1930 established effective tariff rates at about 20%.
Disclaimers
BMO Global Asset Management is a brand name that comprises BMO Asset Management Inc. and BMO Investments Inc. No portion of this communication may be reproduced or distributed to clients.
Commissions, management fees and expenses all may be associated with investments in exchange traded funds. Please read the ETF Facts or simplified prospectus of the BMO ETFs before investing. The indicated rates of return are the historical annual compounded total returns including changes in unit value and reinvestment of all dividends or distributions and do not take into account sales, redemption, distribution or optional charges or income taxes payable by any unitholder that would have reduced returns. Exchange traded funds are not guaranteed, their values change frequently and past performance may not be repeated.
For a summary of the risks of an investment in the BMO ETFs, please see the specific risks set out in the BMO ETF’s prospectus. BMO ETFs trade like stocks, fluctuate in market value and may trade at a discount to their net asset value, which may increase the risk of loss. Distributions are not guaranteed and are subject to change and/or elimination.
BMO ETFs are managed by BMO Asset Management Inc., which is an investment fund manager and a portfolio manager, and a separate legal entity from Bank of Montreal.
The ETF referred to herein is not sponsored, endorsed, or promoted by MSCI and MSCI bears no liability with respect to the ETF or any index on which such ETF is based. The ETF’s prospectus contains a more detailed description of the limited relationship MSCI has with the Manager and any related ETF.
The communication is for information purposes. The information contained herein is not, and should not be construed as, investment, tax or legal advice to any party. Particular investments and/or trading strategies should be evaluated relative to the individual’s investment objectives and professional advice should be obtained with respect to any circumstance.
The viewpoints expressed by the Portfolio Manager represents their assessment of the markets at the time of publication. Those views are subject to change without notice at any time. The information provided herein does not constitute a solicitation of an offer to buy, or an offer to sell securities nor should the information be relied upon as investment advice. Past performance is no guarantee of future results. This communication is intended for informational purposes only.
BMO Global Asset Management is a brand name under which BMO Asset Management Inc. and BMO Investments Inc. operate.
“BMO (M-bar roundel symbol)” is a registered trademark of Bank of Montreal, used under licence.


")


