Alfred Lee CFA, CMT, DMS,
Portfolio Manager and Investment Strategist, Exchange Traded Funds
[email protected]
Portfolio Manager and Investment Strategist, Exchange Traded Funds
[email protected]


In this report:
After taking a pause in its tightening cycle, the Bank of Canada (BoC) raised rates by a quarter-point for a second consecutive meeting as of July. The U.S. Federal Reserve (Fed), which also paused for a meeting, is expected to increase its overnight lending rate in the coming months. However, we don’t see this step backward as a sign the central banks are moving toward aggressive tightening measures. Instead, we believe they are shifting to a data-dependent policy, thus, being more reactive.
Inflation trending in the right direction
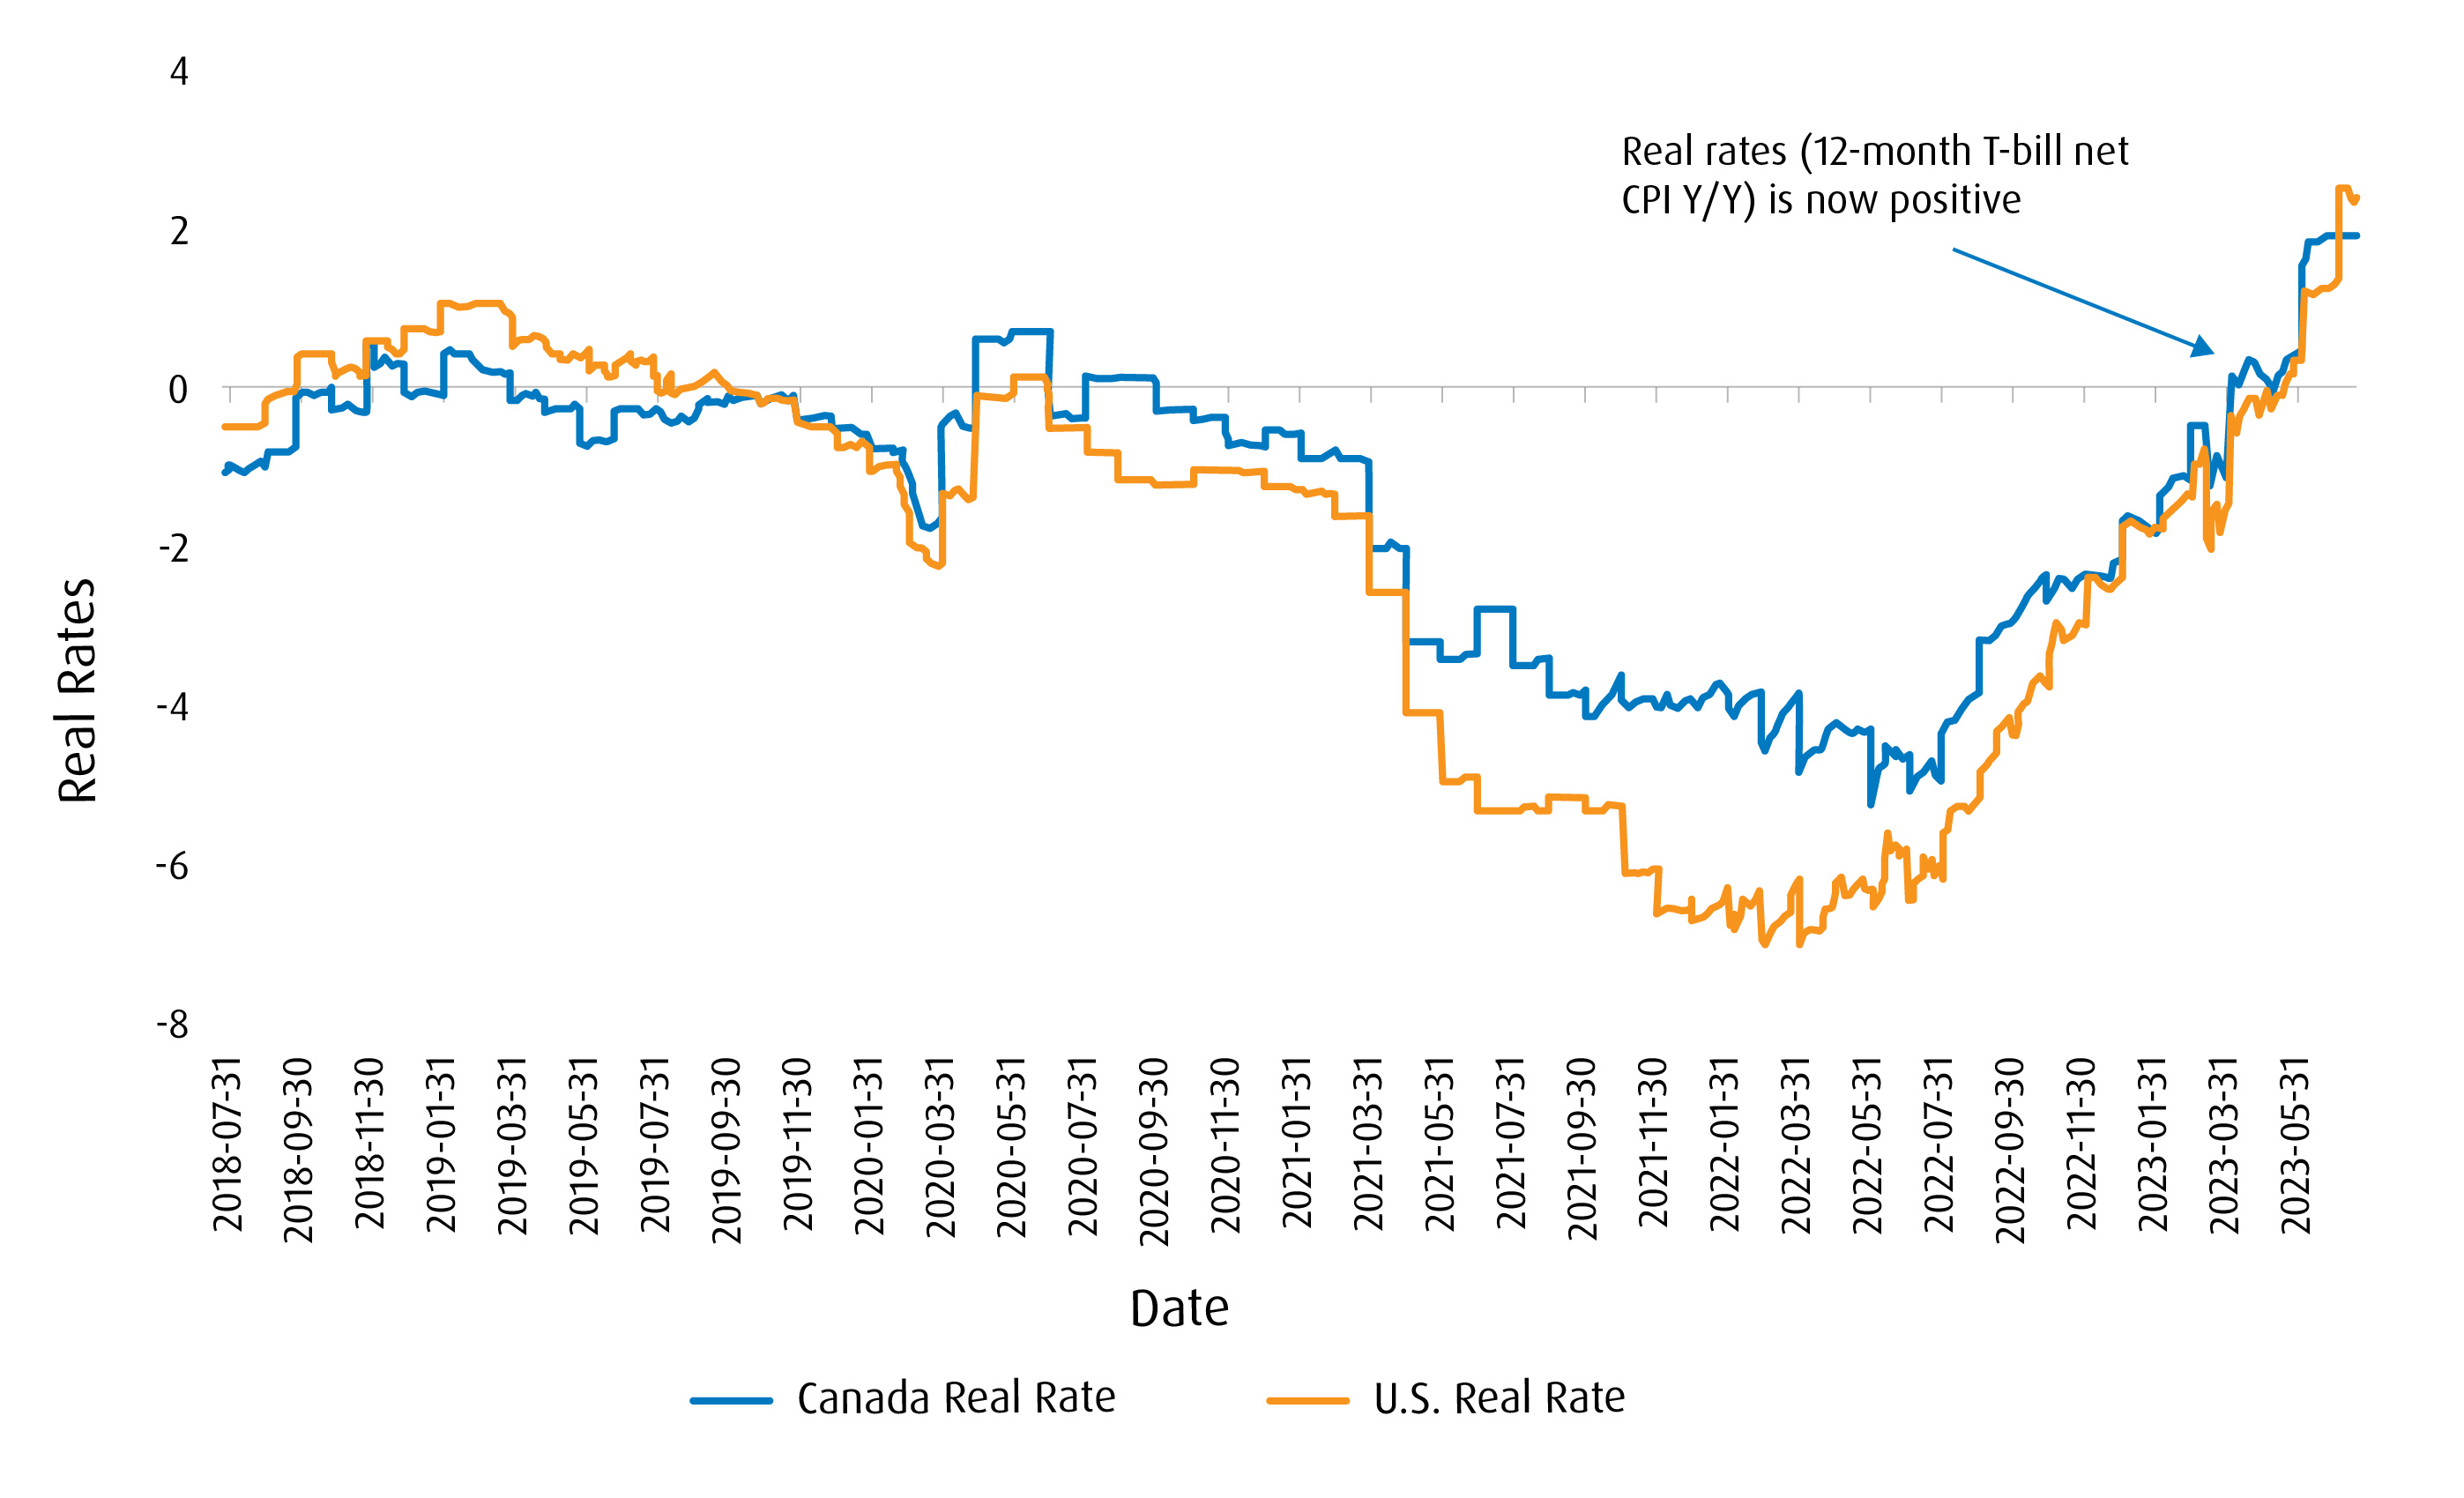
Since the economic reopening, our thesis has been that inflation would be high initially, as demand would outstrip supply and, eventually, we would see disinflationary pressures when supply chains caught up. This looks to be the case now, as data suggests inflation is on the mend. We believe the shift in policy is appropriate — particularly as it takes an average of 18–24 months for higher rates to work their way through the economy. The occasional hike allows the central banks to maintain credibility to implement forward guidance, which could be a tool the Fed and BoC increasingly lean on. Some have argued that a cooling Consumer Price Index (CPI) in Canada and the U.S. has been driven lower by the base effect and higher energy prices a year ago; however, other data suggests inflation is on the mend. Real rates, which we monitor as the difference between the 12-month T-bill and CPI (year over year), have become positive in the last quarter in both countries.
Pressures mount on discretionary spending
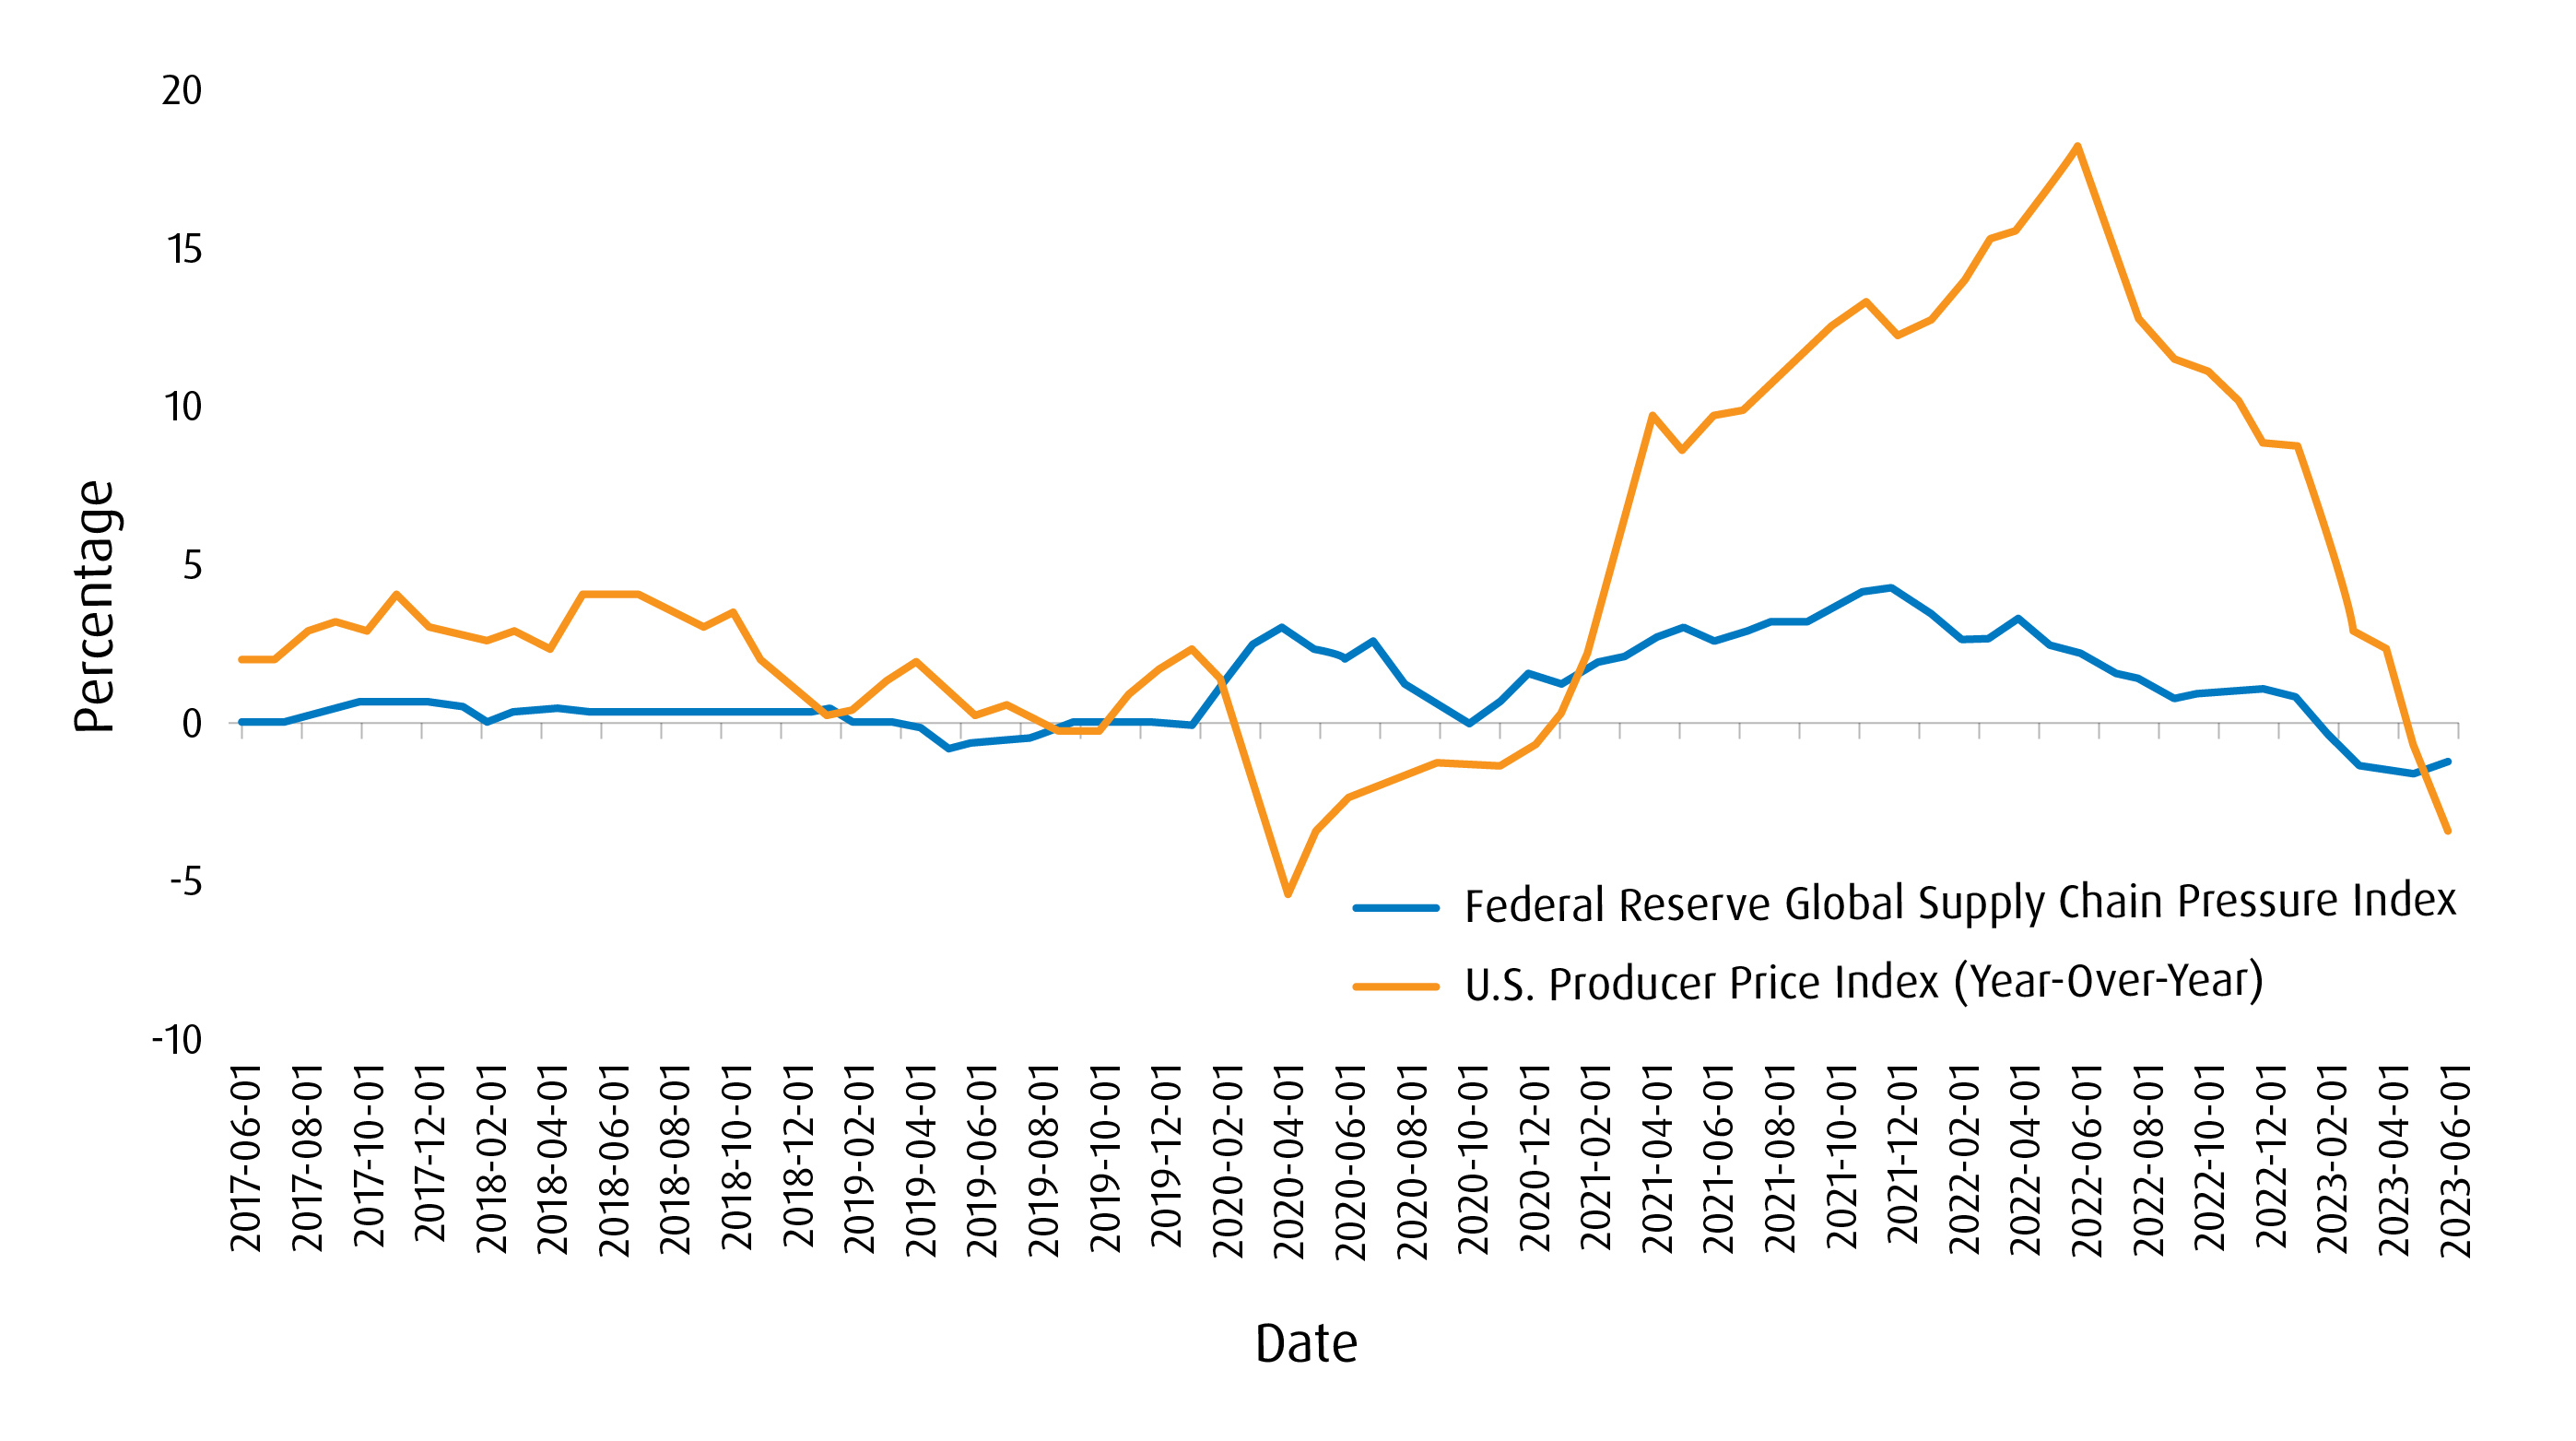
While inflation on services has been more resilient than that of goods, we anticipated this, assuming the lockdowns of years past would lead to demand for travelling and hospitality. The recent U.S. CPI numbers showed hotel and airfare demand to be down. As household debt remains at record levels in Canada, we expect the BoC to have more leverage in its rate hikes, as it places further stress on wallets and discretionary items, such as vacations and restaurants, which will be the easiest to eliminate. On the goods front, leading indicators, such as the Fed’s Global Supply Chain Pressure Index, have more than normalized. As projected in previous quarterly reports, supply in many areas would eventually catch up with demand, leading to disinflation.
The buzz around AI mega-cap Tech stocks
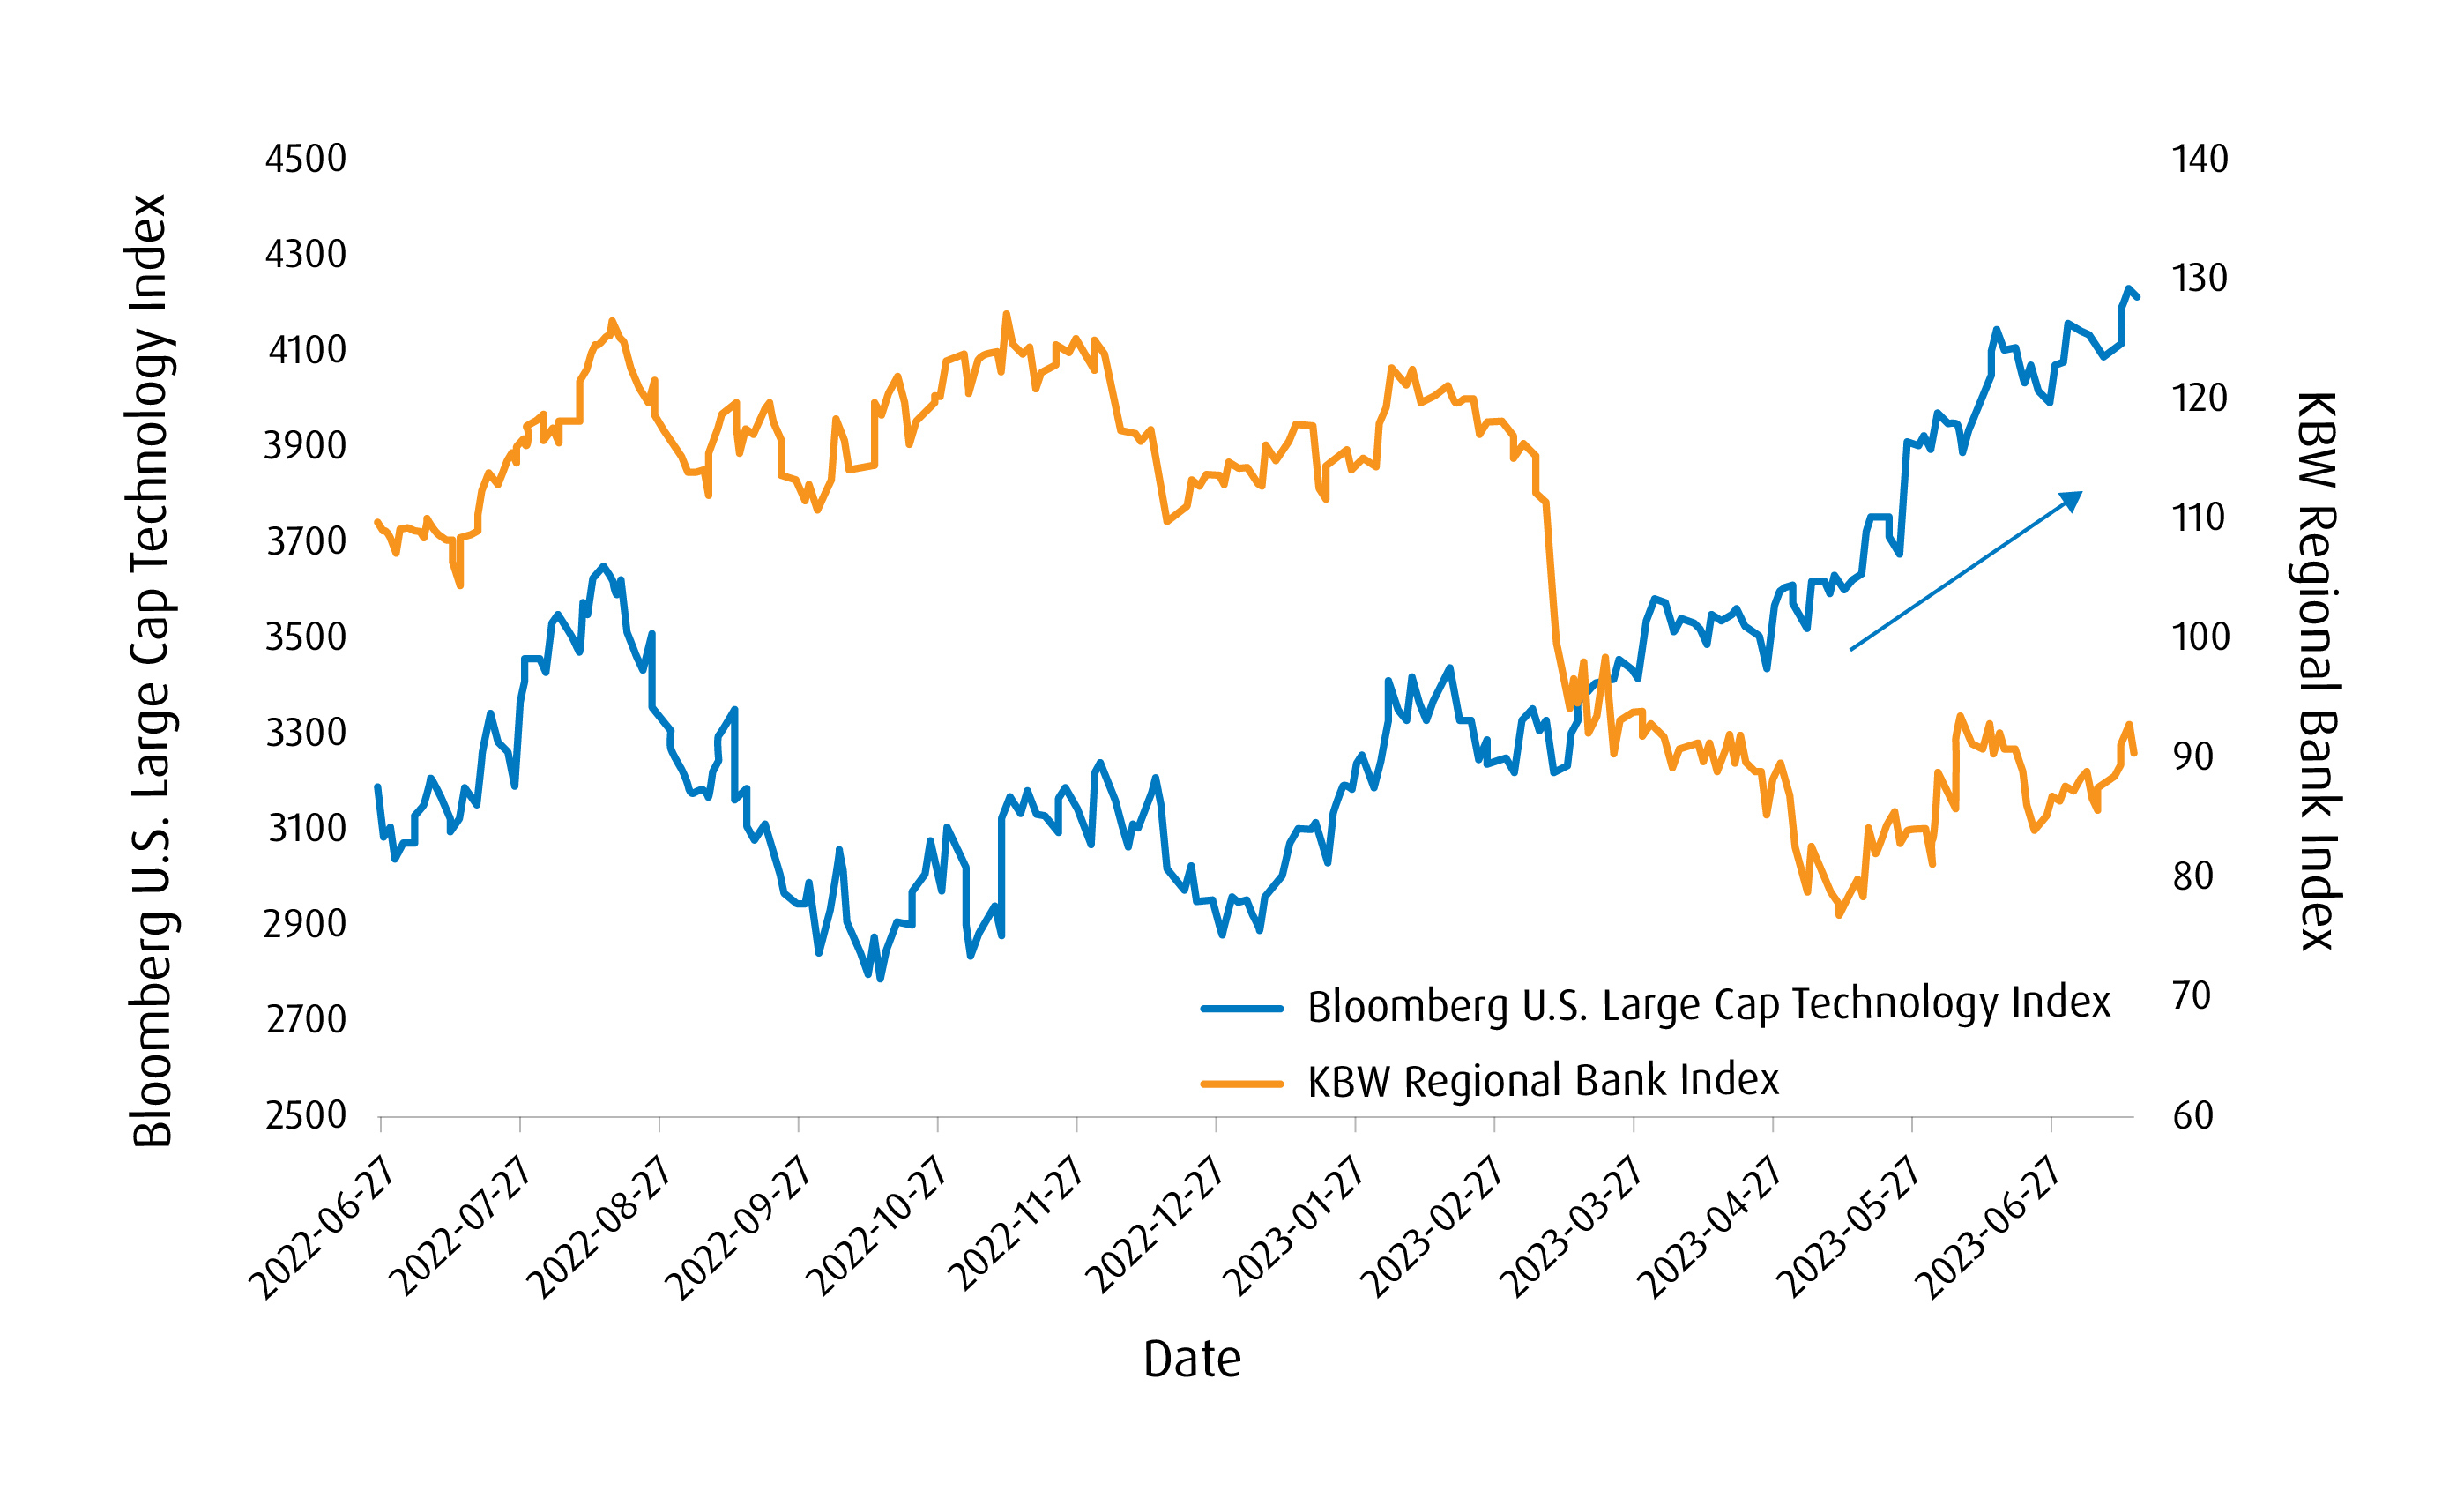
The Fed nearing its terminal rate could not come at a better time, as further hikes would add more pressure on the regional banks and their held-to-maturity portfolios. The easing of monetary tightening also provides a more favourable environment for long-duration stocks like Technology. Since the bankruptcy of Silicon Valley Bank in March, the KBW Regional Bank Index has become negatively correlated with the U.S. Technology sector. In addition, the “buzz” around Artificial Intelligence (AI) will likely provide tailwinds for larger-cap Technology names.
Our view on risk assets
While we remain constructive on risk assets, we are cautious given the ongoing risks. Geo-political threats in the Russia-Ukraine conflict and tensions between China and Taiwan can escalate. As we draw closer to the end of the year, the noise will probably grow between the Republicans and Democrats as the U.S. prepares for a presidential election year. The inverted yield curve should also be watched, and we will look closely at it throughout the report. However, we are still constructive on equities going into the second half, though we believe the pace of gains will moderate. With sustained higher interest rates, a focus on higher quality companies with durable balance sheets should be the focus for equities and fixed income. We also anticipate low volatility to play a role in providing stability in the back half of the year.
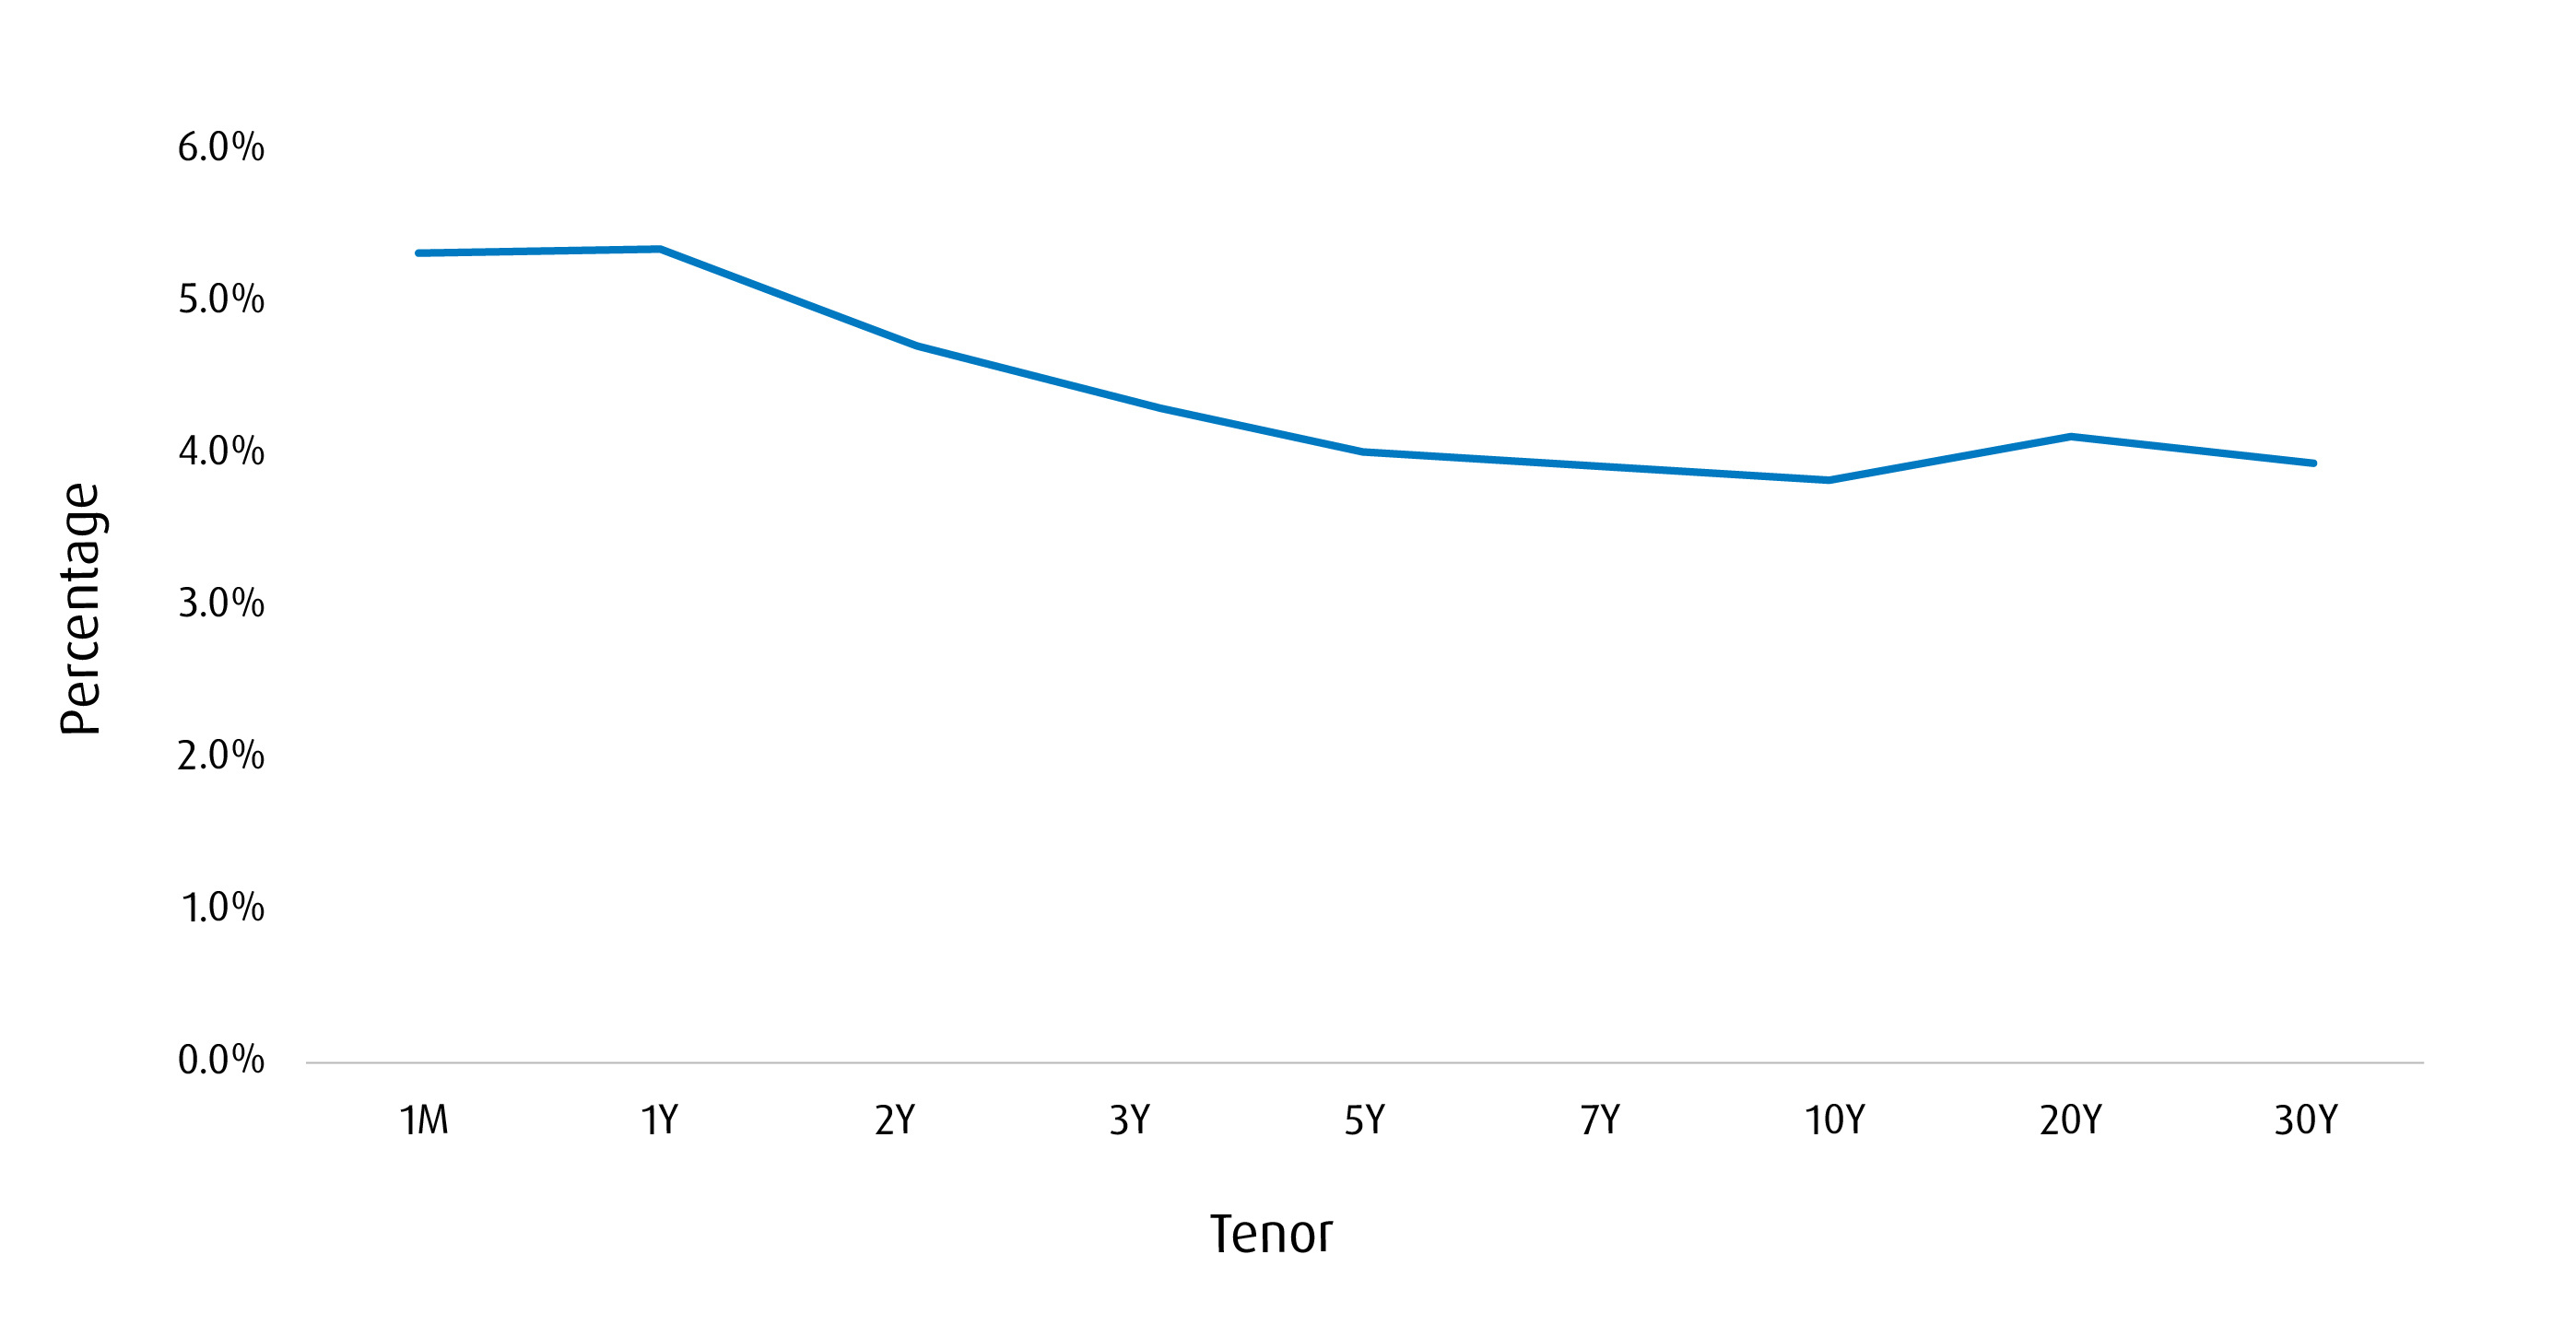
There’s been much focus on the yield curve, given its inversion has been the steepest we’ve seen in decades — and, historically, an inverted yield curve has been one of the most reliable indicators of an impending recession. While recessions rarely bide well for risk assets, investors should note that market dynamics in the last two years have been different, as inflation has been the primary focus. When demand significantly exceeds supply, central banks’ response has been to slam on the proverbial brakes rather than the accelerator via monetary policy. As a result, an inversion of the yield curve suggests that central bankers have successfully engineered a slowdown to equalize demand and supply. If you view the yield curve as the term structure of interest rates, an inversion would suggest the market believes inflation will be controlled. This would be like the yield curve inversion coming off of the inflationary period of the 1980s.
Recommendation: While we would not want to bet against a yield curve, we believe some positives can be taken from its inversion. A normalized yield curve would suggest central bankers have more tightening ahead. We’ve been highlighting the benefits of a bond barbell, which utilizes short-term credit ETFs such as the BMO Short-Term US IG Corporate Bond Hedged to CAD Index ETF (Ticker: ZSU) on the short end of the curve. Complement this with long-term government bond exposure through ETFs, such as the BMO Long-Term US Treasury Bond Index ETF (Ticker: ZTL).
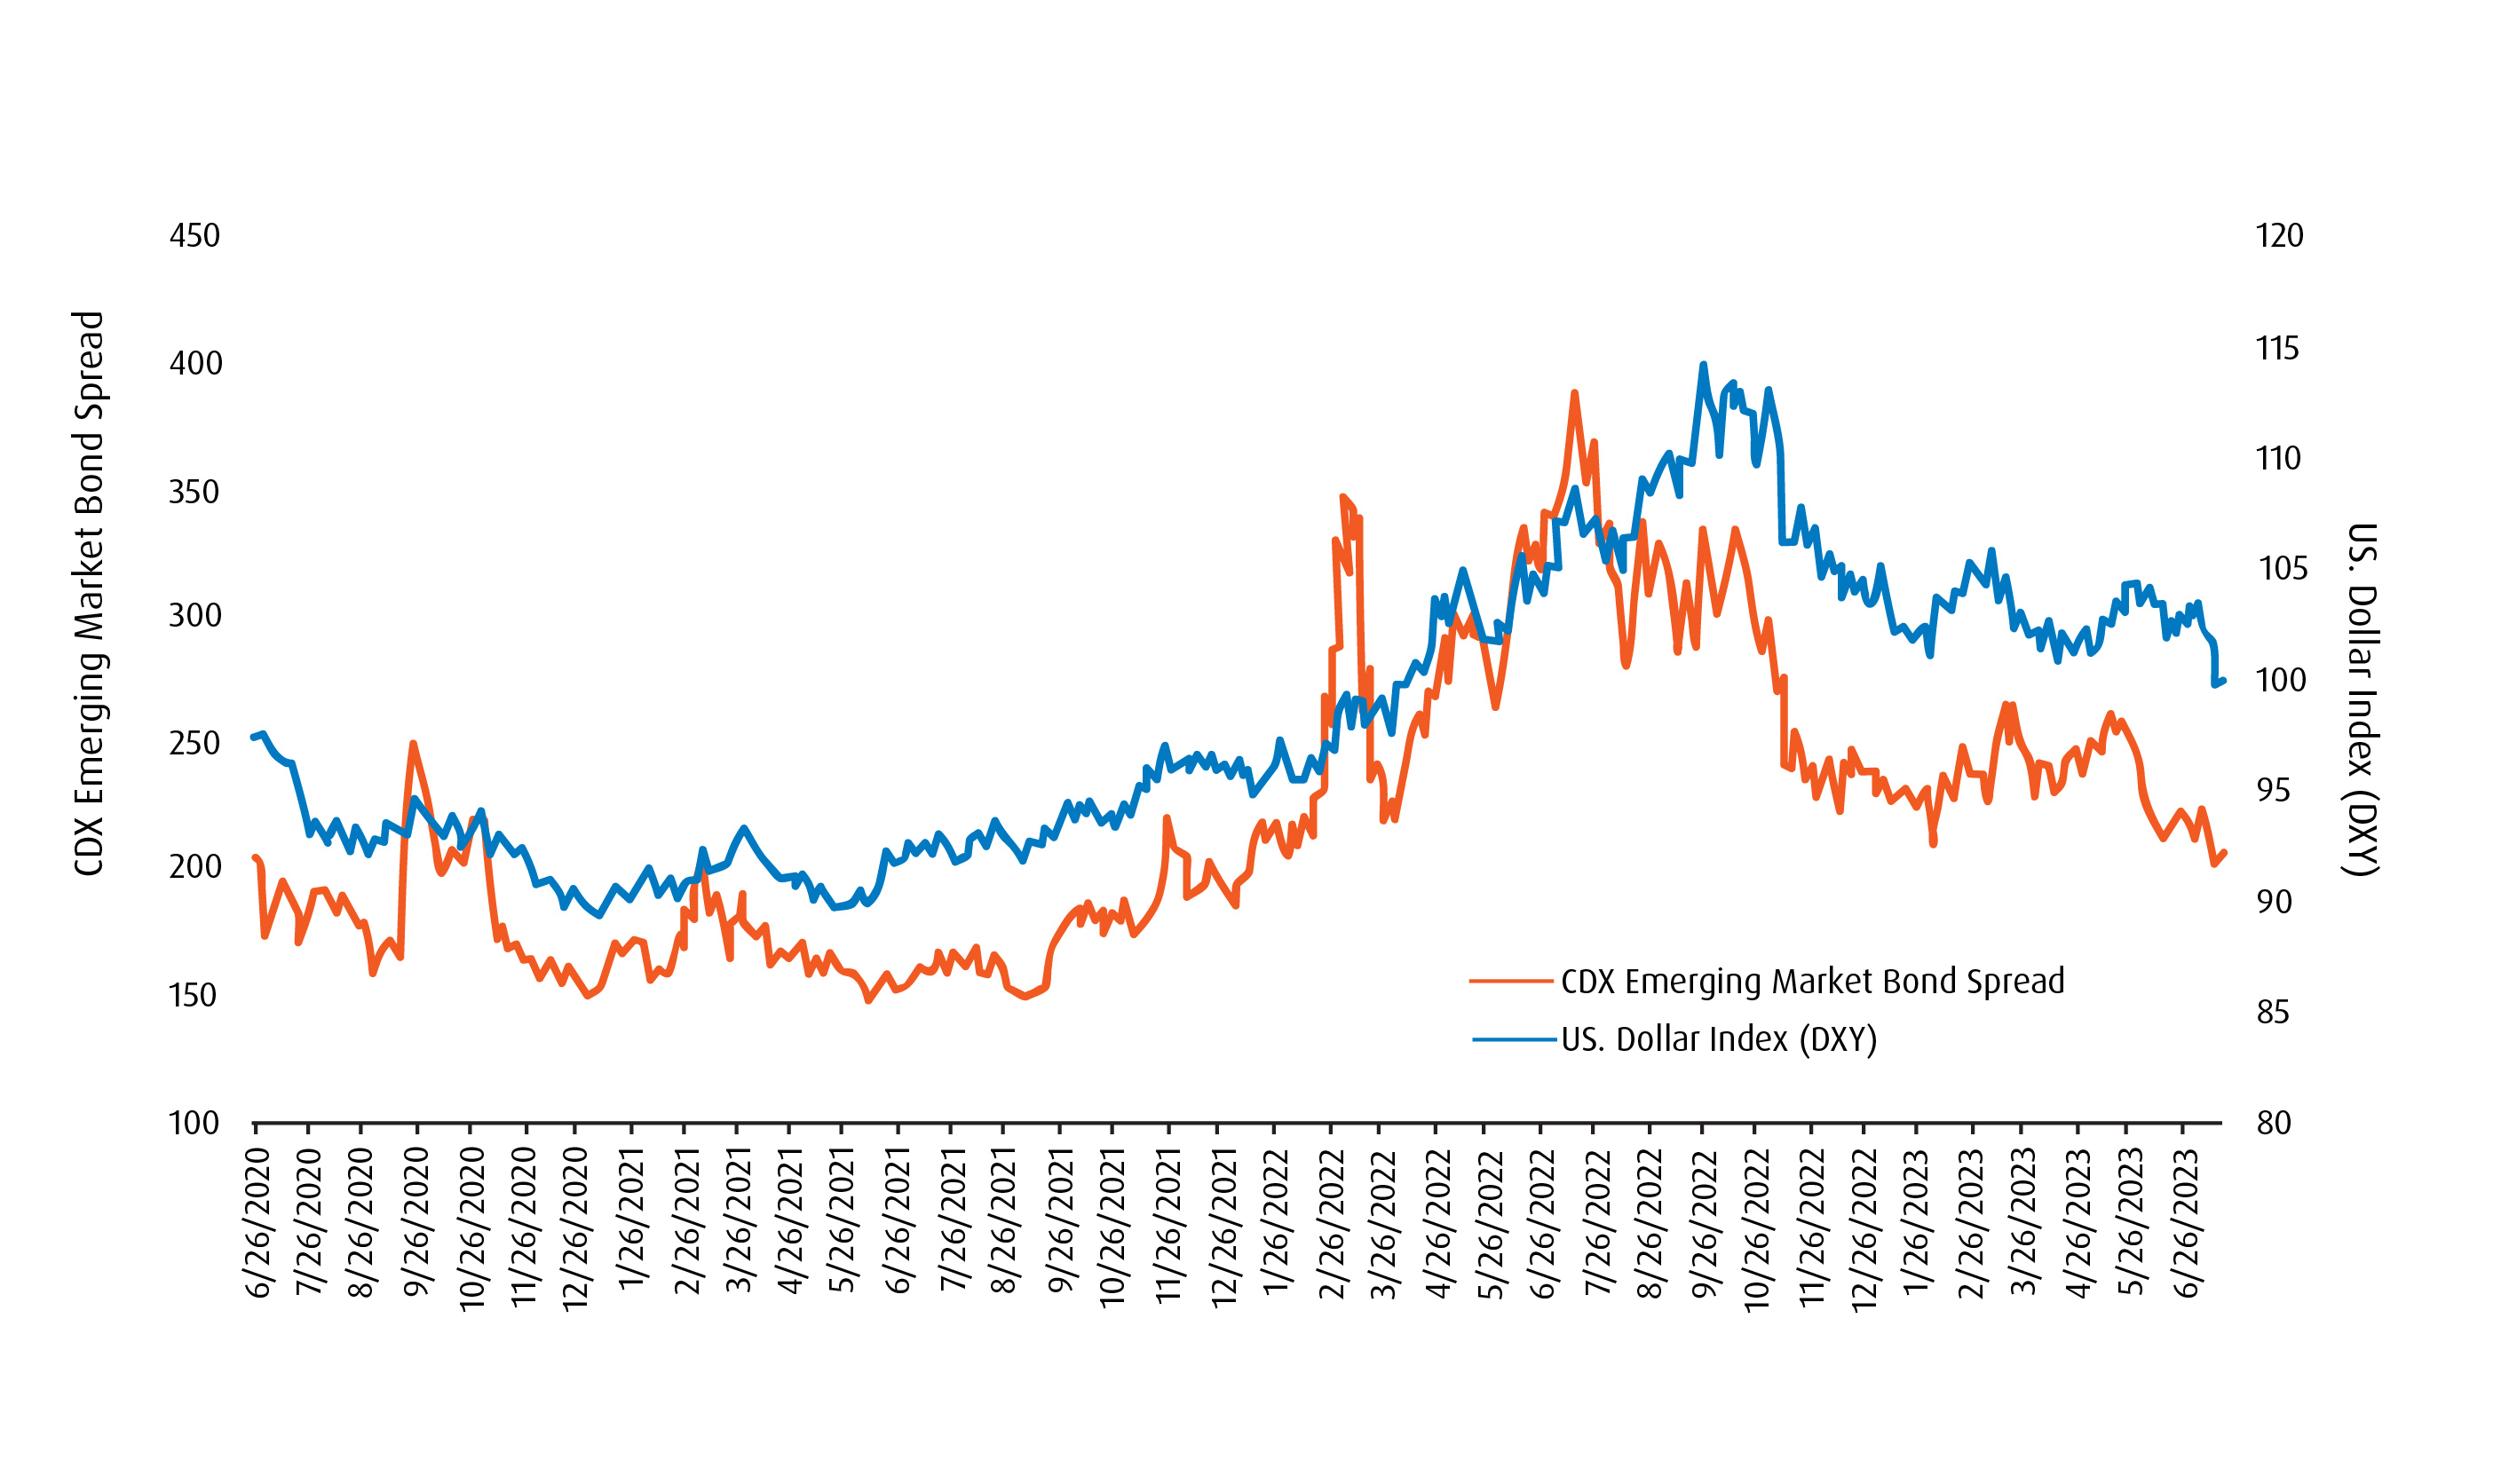
The U.S. dollar (USD) has been a focus for investors for many reasons. The Fed pausing its interest rate hikes and, thus, shifting toward a more data-dependent policy has been one factor. After surging in 2022 on the back of the Fed’s aggressive rate hiking cycle, it has fallen –12.6% since its peak last year.1 Besides the Fed taking more of a reactive stance to fight inflation, growing talks of “de-dollarization” have also risen. As global financial infrastructure is built on the greenback as the world’s reserve currency, it will take decades to move away from the USD. However, a growing number of countries are using their currencies to settle trade. The most notable example is the BRICS nations (Brazil, Russia, India, China and South Africa) working to establish a unified currency backed by gold.
Recommendation: A weakening USD will be interesting to watch on several fronts. Since last fall, we’ve been expecting inflation to dissipate in 2023. While we can’t declare victory yet, there are signs we are trending in the right direction. However, one key concern is the impact of a lower USD on inflation. With the U.S. being an importer of goods, the Fed must ensure a weaker currency does not reignite inflation. Credit spreads in emerging market debt have also tightened as a weaker USD has made debt repayment a greater probability. While our preferred bond exposure is investment grade corporate bonds, it will be interesting to see how exposures, such as the BMO Emerging Markets Bond Hedged to CAD Index ETF (Ticker: ZEF), react to a weakening USD.
After a downright abysmal year in 2022, economic projections were revised downwards, which made a lower hurdle for data to come in better than economists’ expectations. With a string of positive surprises, expectations have now been revised higher, which may lead to some downside surprises, and may weigh on the market in the second half. While we are cautiously optimistic, growing geo-political risk investors may want to take some risk off the table.
Recommendation: Coming into the year, we expected the quality factor to outperform, and it has been off to a great start. At our BMO ETF Economic Forum in February, we highlighted how low volatility would play a more important role in the second half. We continue to believe in pairing low volatility ETFs, such as the BMO Low Volatility US Equity ETF (Ticker: ZLU), with the BMO MSCI USA High Quality Index ETF (Ticker: ZUQ). Both these exposures tend to be defensively oriented in case economic data begins to disappoint; however, they can be very complementary in terms of their tilts toward factor exposures.
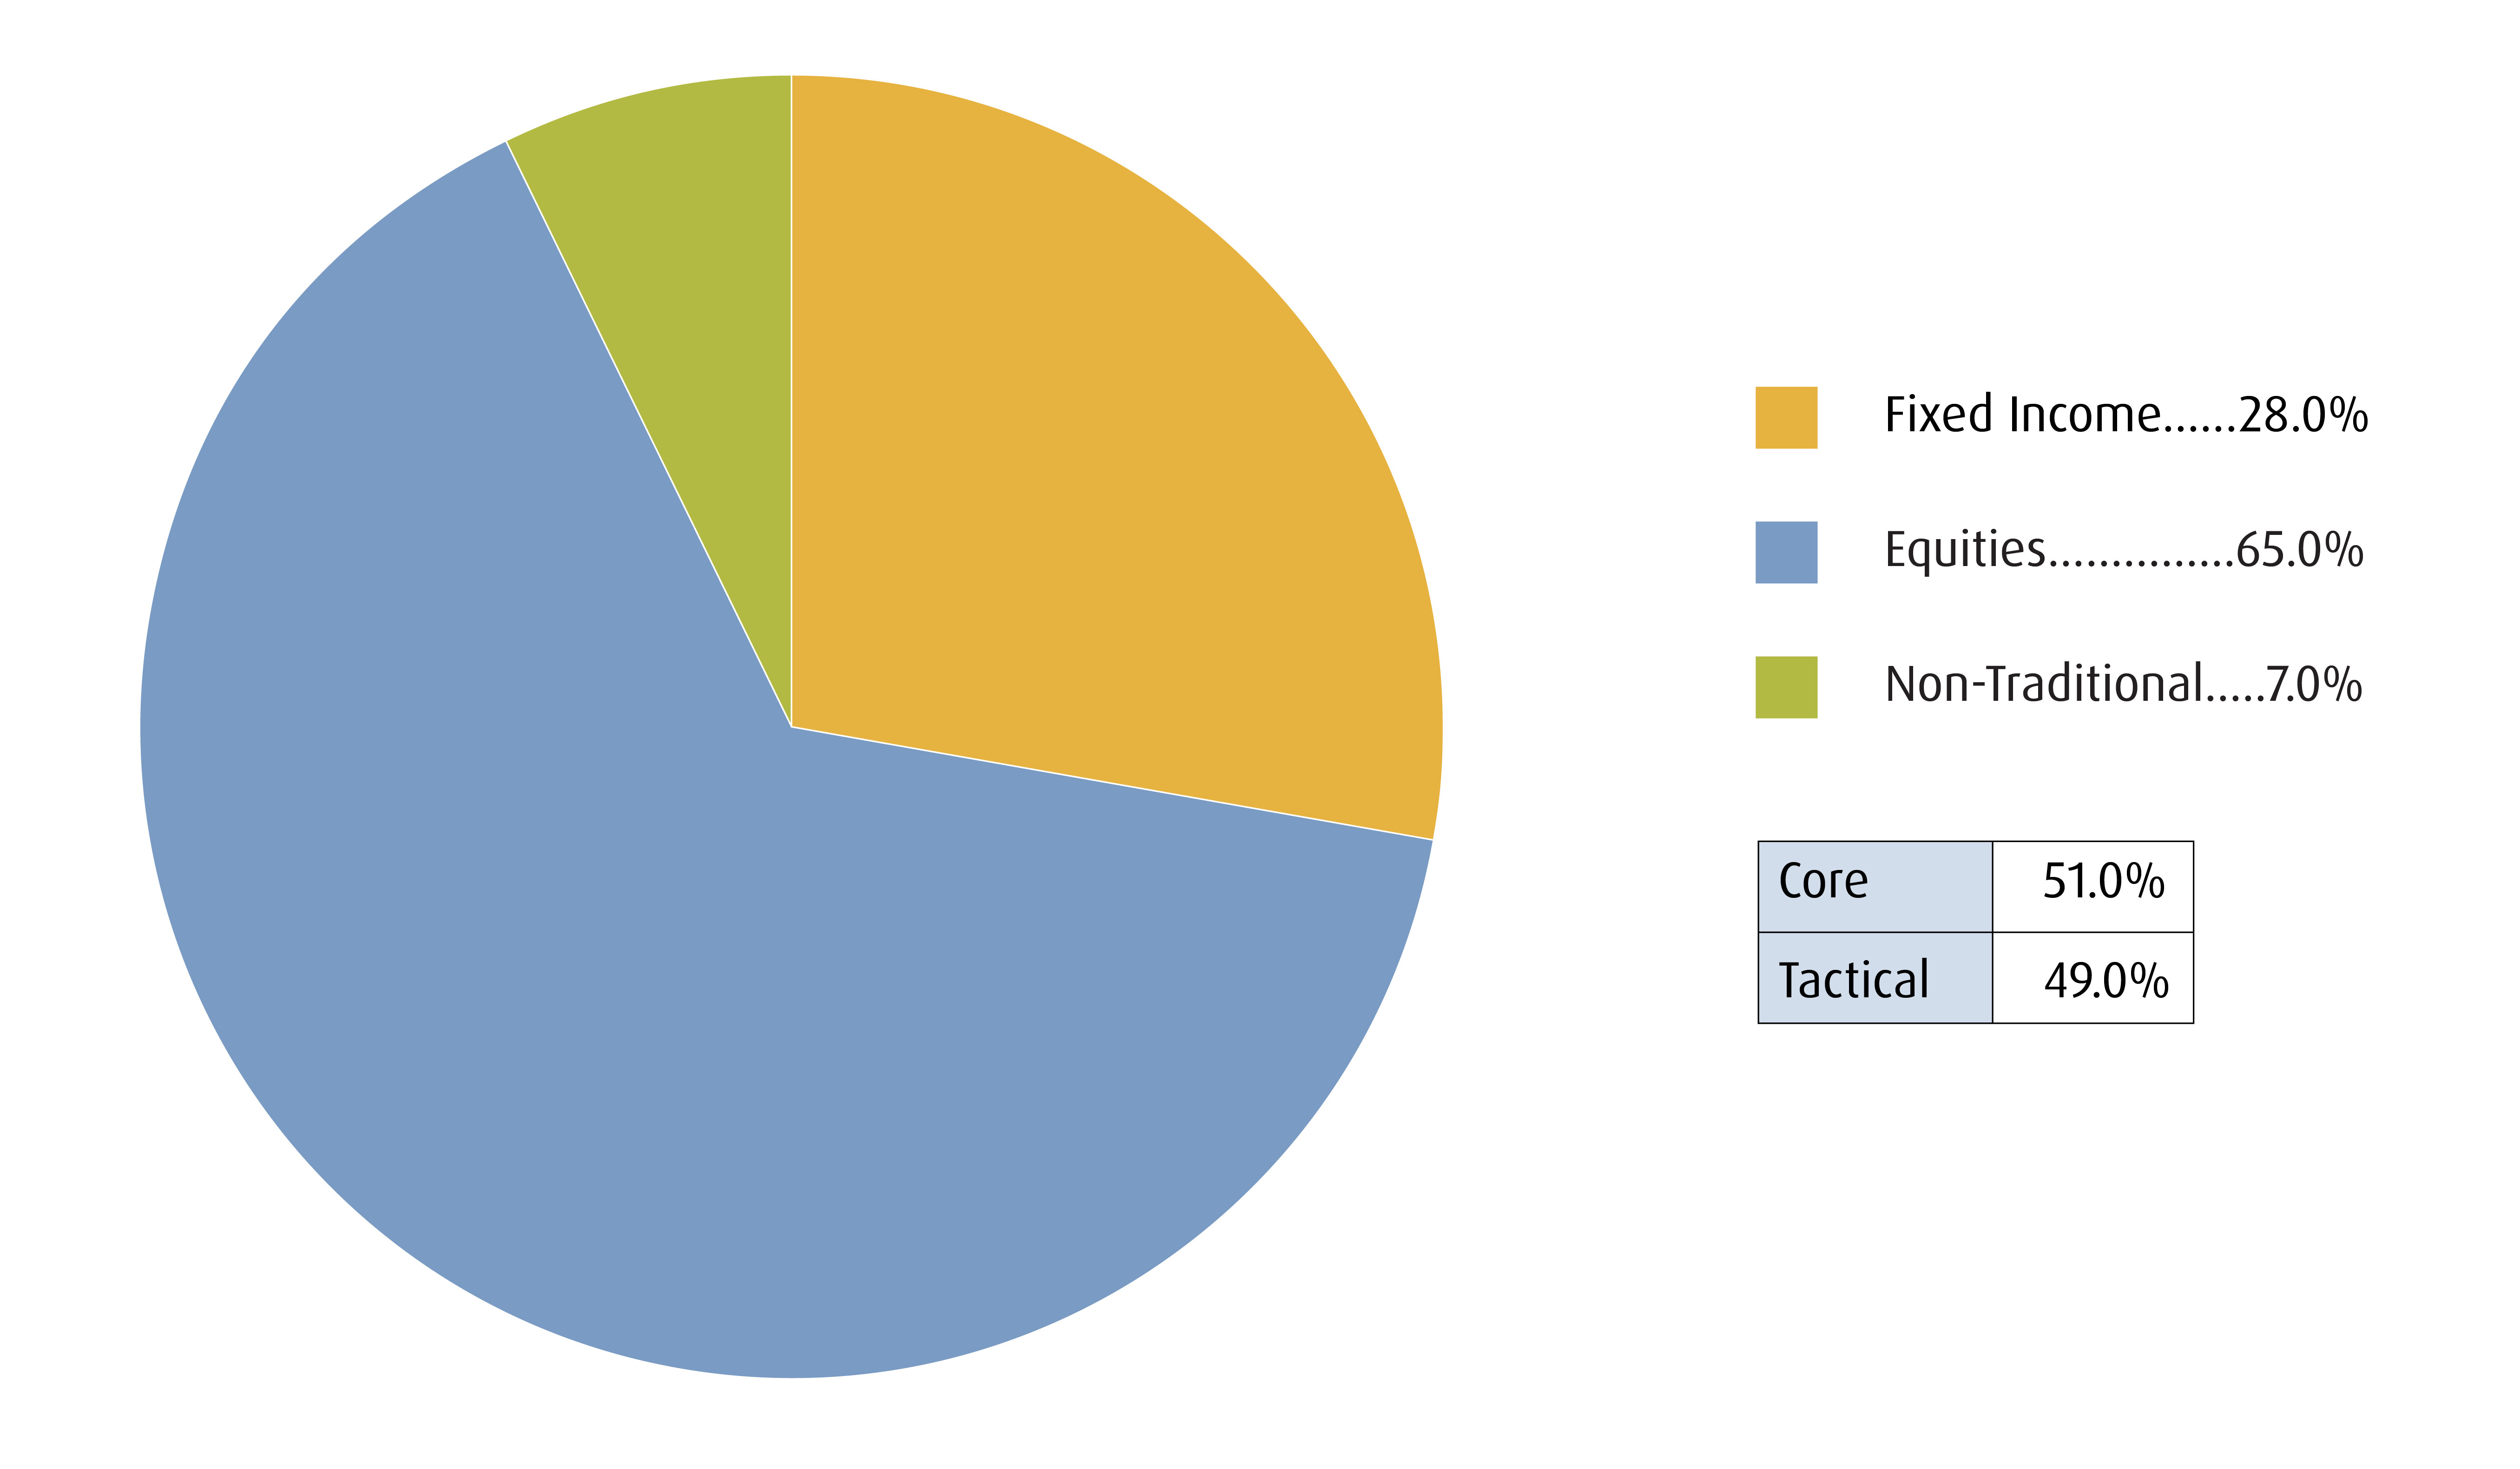
The strategy involves tactically allocating to multiple asset-classes and geographies to achieve long-term capital appreciation and total return by investing primarily in ETFs.
| Ticker | ETF Name | Sector | Positioning | Price | Management Fee* | Weight (%) | 90-Day Vol | Volatility Contribution | Yield(%) | Yield/Vol** |
|---|---|---|---|---|---|---|---|---|---|---|
| Fixed Income | ||||||||||
| ZDB | BMO Discount Bond Index ETF | Fixed Income | Core | $14.31 | 0.09% | 9.0% | 8.4 | 7.5% | 2.5% | 0.30 |
| ZSU | BMO Short-Term US IG Corporate Bond Hedged to CAD Index ETF | Fixed Income | Tactical | $12.99 | 0.25% | 7.0% | 4.4 | 3.0% | 3.2% | 0.74 |
| ZTIP.F | BMO Short-Term US TIPS Index ETF (Hedged Units) | Fixed Income | Tactical | $28.11 | 0.15% | 5.0% | 3.3 | 1.6% | 5.1% | 1.58 |
| ZTL | BMO Long-Term US Treasury Bond Index ETF | Fixed Income | Tactical | $40.15 | 0.20% | 5.0% | 9.3 | 4.6% | 3.5% | 0.37 |
| ZST | BMO Ultra Short-Term Bond ETF | Fixed Income | Tactical | $48.67 | 0.30% | 2.0% | 1.5 | 0.3% | 4.7% | 3.17 |
| Total Fixed Income | 28.0% | 16.9% | ||||||||
| Equities | ||||||||||
| ZLB | BMO Low Volatility Canadian Equity ETF | Equity | Core | $41.48 | 0.35% | 17.0% | 8.1 | 13.5% | 2.7% | 0.33 |
| ZRE | BMO Equal Weight REITs Index ETF | Equity | Tactical | $21.40 | 0.05% | 4.0% | 14.1 | 5.6% | 5.0% | 0.36 |
| ZLU | BMO Low Volatility US Equity ETF | Equity | Core | $46.16 | 0.30% | 8.0% | 10.2 | 8.0% | 2.3% | 0.23 |
| ZLD | BMO Low Volatility International Equity Hedged to CAD ETF | Equity | Core | $24.84 | 0.40% | 7.0% | 10.9 | 7.5% | 2.7% | 0.25 |
| ZEO | BMO Equal Weight Oil & Gas Index ETF | Equity | Tactical | $58.53 | 0.55% | 4.0% | 21.6 | 8.5% | 5.1% | 0.24 |
| ZUH | BMO Equal Weight US Health Care Hedged to CAD Index ETF | Equity | Tactical | $70.10 | 0.35% | 4.0% | 13.1 | 5.1% | 0.4% | 0.03 |
| ZEB | BMO Equal Weight Banks Index ETF | Equity | Tactical | $34.07 | 0.55% | 8.0% | 15.3 | 12.1% | 4.9% | 0.32 |
| ZUQ | BMO MSCI USA High Quality Index ETF | Equity | Core | $61.53 | 0.30% | 10.0% | 13.6 | 13.3% | 1.0% | 0.07 |
| ZWT | BMO Covered Call Technology ETF | Equity | Tactical | $33.37 | 0.65% | 3.0% | 17.1 | 5.0% | 4.0% | 0.23 |
| Total Equity | 65.0% | 78.6% | ||||||||
| Non-Traditional Hybrids | ||||||||||
| ZPR | BMO Laddered Preferred Share Index ETF | Hybrid | Tactical | $8.80 | 0.45% | 3.0% | 10.4 | 3.1% | 6.1% | 0.59 |
| ZBI | BMO Canadian Bank Income Index ETF | Hybrid | Tactical | $27.16 | 0.25% | 4.0% | 3.5 | 1.4% | 3.4% | 0.97 |
| Total Alternatives | 7.0% | 4.4% | ||||||||
| Total Cash | 0.0% | 0.0 | 0.0% | 0.0% | ||||||
| Portfolio | 0.32% | 100.0% | 10.2% | 100.0% | 3.2% | 0.31 | ||||
Source: Bloomberg, BMO Asset Management Inc., as of July 17, 2023. *Management Fee as of July 17, 2023. ** Yield calculations for bonds are based on yield to maturity, including coupon payments and any capital gain or loss that the investor will realize by holding the bonds to maturity and. For equities, it is based on the most recent annualized income received divided by the market value of the investments. Please note yields of equities will change from month to month based on market conditions. The portfolio holdings are subject to change without notice and only represent a small percentage of portfolio holdings. They are not recommendations to buy or sell any particular security.
| Ticker | Name | Weight |
|---|---|---|
| ZLB | BMO LOW VOLATILITY CANADIAN EQUITY ETF | 17.0% |
| ZUQ | BMO MSCI USA HIGH QUALITY INDEX ETF | 10.0% |
| ZDB | BMO DISCOUNT BOND INDEX ETF | 9.0% |
| ZLU | BMO LOW VOLATILITY US EQUITY ETF | 8.0% |
| ZEB | BMO EQUAL WEIGHT BANKS INDEX ETF | 8.0% |
| ZSU | BMO SHORT-TERM US IG CORPORATE BOND HEDGED TO CAD INDEX ETF | 7.0% |
| ZLD | BMO LOW VOLATILITY INTERNATIONAL EQUITY HEDGED TO CAD ETF | 7.0% |
| ZTIP.F | BMO SHORT-TERM US TIPS INDEX ETF (HEDGED UNITS) | 5.0% |
| ZTL | BMO LONG-TERM US TREASURY BOND INDEX ETF | 5.0% |
| ZRE | BMO EQUAL WEIGHT REITS INDEX ETF | 4.0% |
| ZEO | BMO EQUAL WEIGHT OIL & GAS INDEX ETF | 4.0% |
| ZUH | BMO EQUAL WEIGHT US HEALTH CARE HEDGED TO CAD INDEX ETF | 4.0% |
| ZBI | BMO CANADIAN BANK INCOME INDEX ETF | 4.0% |
| ZWT | BMO COVERED CALL TECHNOLOGY ETF | 3.0% |
| ZPR | BMO LADDERED PREFERRED SHARE INDEX ETF | 3.0% |
| ZST | BMO ULTRA SHORT-TERM BOND ETF | 2.0% |
| Total | 100.0% |

| Federal | 48.4% | Weighted Average Term | 12.01 |
| Provincial | 14.2% | Weighted Average Duration | 6.68 |
| Investment Grade Corporate | 37.4% | Weighted Average Coupon | 2.21% |
| Non-Investment Grade Corporate | 0.0% | Weighted Average Current Yield | 2.26% |
| Weighted Average Yield to Maturity | 3.78% |
Weighted Average Term: The average interest received by a bond investor, expressed on a nominal annual basis.
Weighted Average Current Yield: The market value-weighted average coupon divided by the weighted average market price of bonds.
Weighted Average Yield to Maturity: The market value-weighted average yield to maturity includes coupon payments and any capital gain or loss that the investor will realize by holding the bonds to maturity.
Weighted Average Duration: The market value-weighted average duration of underlying bonds divided by the weighted average market price of the underlying bonds. Duration is a measure of the sensitivity of the price of a fixed income investment to a change in interest rates.
Weighted Average Coupon: The average time it takes for bonds to mature in a fixed income portfolio.
The portfolio holdings are subject to change without notice and only represent a small percentage of portfolio holdings. They are not recommendations to buy or sell any particular security.
Source: Bloomberg, BMO Global Asset Management, as of July 17, 2023.
Visit bmo.com/etfs or contact Client Services at 1−800−361−1392.
To listen to our Views From the Desk BMO ETF Podcasts, please visit bmoetfs.ca.
BMO ETF Podcasts are also available on


Volatility: Measures how much the price of a security, derivative, or index fluctuates. The most commonly used measure of volatility when it comes to investment funds is standard deviation.
Yield curve: A line that plots the interest rates of bonds having equal credit quality but differing maturity dates. A normal or steep yield curve indicates that long-term interest rates are higher than short-term interest rates. A flat yield curve indicates that short-term rates are in line with long-term rates, whereas an inverted yield curve indicates that short-term rates are higher than long-term rates.
Any statement that necessarily depends on future events may be a forward-looking statement. Forward-looking statements are not guarantees of performance. They involve risks, uncertainties and assumptions. Although such statements are based on assumptions that are believed to be reasonable, there can be no assurance that actual results will not differ materially from expectations. Investors are cautioned not to rely unduly on any forward-looking statements. In connection with any forward-looking statements, investors should carefully consider the areas of risk described in the most recent simplified prospectus.
The viewpoints expressed by the individuals represents their assessment of the markets at the time of publication. Those views are subject to change without notice at any time. The information provided herein does not constitute a solicitation of an offer to buy, or an offer to sell securities nor should the information be relied upon as investment advice. Past performance is no guarantee of future results. This communication is intended for informational purposes only.
This communication is for information purposes. The information contained herein is not, and should not be construed as, investment, tax or legal advice to any party. Particular investments and/or trading strategies should be evaluated relative to the individual’s investment objectives and professional advice should be obtained with respect to any circumstance.
Index returns do not reflect transactions costs or the deduction of other fees and expenses and it is not possible to invest directly in an Index. Past performance is not indicative of future results.
The Index is a product of S&P Dow Jones Indices LLC or its affiliates (“SPDJI”), and has been licensed for use by the Manager. S&P®, S&P 500®, US 500, The 500, iBoxx®, iTraxx® and CDX® are trademarks of S&P Global, Inc. or its affiliates (“S&P”) and Dow Jones® is a registered trademark of Dow Jones Trademark Holdings LLC (“Dow Jones”), and these trademarks have been licensed for use by SPDJI and sublicensed for certain purposes by the Manager. The ETF is not sponsored, endorsed, sold or promoted by SPDJI, Dow Jones, S&P, their respective affiliates, and none of such parties make any representation regarding the advisability of investing in such product(s) nor do they have any liability for any errors, omissions, or interruptions of the Index.
The ETFs referred to herein is not sponsored, endorsed, or promoted by MSCI and MSCI bears no liability with respect to the ETF or any index on which such ETF is based. The ETF’s prospectus contains a more detailed description of the limited relationship MSCI has with the Manager and any related ETF.
Commissions, management fees and expenses all may be associated with investments in exchange traded funds. Please read the ETF Facts or prospectus of the BMO ETFs before investing. Exchange traded funds are not guaranteed, their values change frequently and past performance may not be repeated.
For a summary of the risks of an investment in the BMO ETFs, please see the specific risks set out in the BMO ETF’s prospectus. BMO ETFs trade like stocks, fluctuate in market value and may trade at a discount to their net asset value, which may increase the risk of loss. Distributions are not guaranteed and are subject to change and/or elimination.
BMO ETFs are managed by BMO Asset Management Inc., which is an investment fund manager and a portfolio manager, and a separate legal entity from Bank of Montreal.
BMO Global Asset Management is a brand name under which BMO Asset Management Inc. and BMO Investments Inc. operate.
®/™Registered trademarks/trademark of Bank of Montreal, used under licence.
This podcast presentation is for informational purposes only. No part of this presentation may be reproduced, stored in a retrieval system or transmitted, in any form or by any means, electronic, mechanical, recording or otherwise, without the written permission of BMO Investments Inc. or BMO Asset Management Inc. (collectively, BMO GAM) ).
For greater certainty, no part of this presentation may be provided to investors and/or potential investors without the written permission of BMO GAM. The information contained herein is not, and should not be construed as, investment advice and or tax advice to any individual. Investments should be evaluated relative to the individual’s investment objectives and professional advice should be obtained with respect to any circumstance. This communication is intended for information purposes only. Any statement that necessarily depends on future events may be a forward-looking statement. Forward-looking statements are not guarantees of performance. They involve risks, uncertainties and assumptions. Although such statements are based on assumptions that are believed to be reasonable, there can be no assurance that actual results will not differ materially from expectations. Investors are cautioned not to rely unduly on any forward-looking statements. In connection with any forward-looking statements, investors should carefully consider the areas of risk described in the most recent simplified prospectus. BMO GAM undertakes no obligation to update publicly or otherwise revise any forward-looking statement or information whether as a result of new information, future events or other such factors which affect this information, except as required by law.
The viewpoints expressed by the Portfolio Manager represents their assessment of the markets at the time of publication. Those views are subject to change without notice at any time without any kind of notice. The information provided herein does not constitute a solicitation of an offer to buy, or an offer to sell securities nor should the information be relied upon as investment advice. Past performance is no guarantee of future results. This communication is intended for informational purposes only.
The portfolio holdings are subject to change without notice and only represent a small percentage of portfolio holdings. They are not recommendations to buy or sell any particular security.
Commissions, management fees and expenses (if applicable) all may be associated with investments in BMO ETFs and ETF Series of the BMO Mutual Funds. Please read the ETF facts or prospectus of the relevant BMO ETF or ETF Series before investing. BMO ETFs and ETF Series are not guaranteed, their values change frequently and past performance may not be repeated.
For a summary of the risks of an investment in the BMO ETFs or ETF Series of the BMO Mutual Funds, please see the specific risks set out in the prospectus. BMO ETFs and ETF Series trade like stocks, fluctuate in market value and may trade at a discount to their net asset value, which may increase the risk of loss. Distributions are not guaranteed and are subject to change and/or elimination.
BMO ETFs are managed by BMO Asset Management Inc., which is an investment fund manager and a portfolio manager, and a separate legal entity from Bank of Montreal. ETF Series of the BMO Mutual Funds are managed by BMO Investments Inc., which is an investment fund manager and a separate legal entity from Bank of Montreal.
BMO Global Asset Management is a brand name that comprises BMO Asset Management Inc. and BMO Investments Inc.
®/™Registered trade-marks/trade-mark of Bank of Montreal, used under licence.
Copyright © 2022 Prosper Experiential Media. All rights reserved. | Privacy Policy | Terms & Conditions
© 2022 BMO Global Asset Management All rights reserved.

Kornel is the host of the Build Wealth Canada Podcast, and has been featured for paying off his mortgage in only 6 years while still in his 20s, and becoming one of Canada’s youngest retirees at the age of 32. He now runs a top personal finance and investing podcast created specifically for Canadians with well over 1.4 million downloads, as well as one of Canada’s largest personal finance and investing conferences. There he interviews the top personal finance experts to share their best practices, tips and tactics when it comes to investing and financial planning in Canada.

Jessica is a sought-after millennial money expert, Accredited Financial Counsellor Canada®, media personality, and host of the popular More Money Podcast.
Like many millennials, Jessica graduated university during the Great Recession with student loans to pay off, no job, and zero idea how money worked. As it turned out, she wasn’t alone. The lack of relatable and non-judgemental financial advice available inspired her to found MoorMoney Media Inc., a financial education company that includes online courses, her signature event series the Millennial Money Meetup®, a YouTube channel, and one of the leading podcasts in Canada with over 2 million downloads – the More Money Podcast.
Jessica is also a regular on-air TV personality on CTV News’ Mind the Gap panel and BNN Bloomberg, has been quoted by the media as a money expert hundreds of times, and often works as an influencer with big financial brands such as TD, BMO, PC Financial, and Quickbooks.

Saijal Patel is the Founder and CEO of Saij Wealth Consulting, a financial consultancy and education platform with a mission to help women create financial independence and security through the company’s online programs. She works with financial institutions to better serve the needs of female investors, and companies build effective financial wellness & inclusion programs for all employees. With more than twenty years’ experience in the financial industry in North America and Asia, Saijal is Chartered Financial Analyst (CFA) Charterholder and has held positions as a financial strategist and analyst.
Saijal is the creator and host of Strictly Money, Canada’s only national personal finance program. She’s a former business anchor and correspondent for Canada’s Business News Network (BNN), and CNBC Asia where she delivered commentary and analysis on Asian economies, stock markets and corporate news to more than 300 million households around the world. Her coverage earned her recognition as one of the most influential South Asian Women Executives in the Media and Entertainment Industry.

Andres Rincon heads the ETF Sales and Strategy desk at TD Securities. Mr. Rincon advises both institutional and wealth investors on ETF strategies, publishes a broad array of ETF publications, and works with TD’s ETF market making team in facilitating ETF orders. Andres joined TD Securities in 2008, first managing credit risk for the dealer, and later as a member of the Equity Derivatives division on the options sales desk. After four years leading equity derivatives sales and research in London, England, Andres moved back to Toronto. In 2016 Andres took on the task of expanding TD Securities’ ETF strategy platform. He is also a Chartered Market Technician (CMT).

Valerie Grimba runs the Global ETF Sales and Strategy team at RBC Capital Markets. In this role, she is responsible for providing solutions to help RBC’s institutional clients better understand and implement ETF strategies. She also works closely with ETF issuers to help facilitate ETF trading and create markets for their ETF products. Valerie has more than 15 years of global institutional sales and trading experience, spanning trading floors across Canada, the US and Australasia.
Valerie received her HBA with distinction from the Richard Ivey School of Business, Western University, and has attained several global market accreditations with the ability to trade on numerous international equity exchanges including Canada, the US, Australia and New Zealand.

Tony’s ETF analysis and reviews have been featured in multiple North American financial and investing media platforms, including U.S. News & World Report, USA Today Blueprint, TheStreet, Benzinga, and The Motley Fool. Currently, he is the Lead ETF Analyst for ETF Central, a partnership between the NYSE and Trackinsight. Previously, he also contributed content for the ETF platforms of both the Cboe Canada and Nasdaq exchanges.
Embracing the passive investing philosophy of John Bogle and the factor investing method of Eugene Fama and Kenneth French, Tony offers insights into portfolio management, investment selection, and asset allocation strategies. Tony earned a bachelor of arts degree in Criminology from Simon Fraser University in British Columbia, Canada, graduating in 2019. In 2023, Tony completed graduate studies at Columbia University in New York City, earning a master of science degree in Enterprise Risk Management.
Tony has completed numerous Canadian Securities Courses and has his Certified ETF Advisor (CETF®) designation from The ETF Institute. When he’s not reading about ETFs or writing about them, Tony likes to fiddle with and admire his watch collection. He also frequently travels to tropical locations, where he can be found floating in the ocean and eating fruit.

Matt joined the BMO ETF portfolio management team in 2012, specializing in fixed income. He is currently the team lead for all fixed income portfolios managed by BMO ETFs. In his role as portfolio manager and trader, Matt, and his team, are responsible for all segments of the fixed income market, both in Canada and internationally. Matt has over a decade of industry experience in managing and trading Canadian federal, provincial, corporate and real return bonds; US Treasury and corporate bonds, both investment grade and high yield (cash bonds and CDX); as well as, emerging market debt. Matt has spent his entire career at BMO joining the bank in 2009. Matt holds an HBA and MBA from the Richard Ivey School of Business at the University of Western Ontario and is a CFA Charter holder.

Chris has over two decades of experience in the investment industry and currently serves as portfolio manager for derivative-based and equity-based portfolios. This includes the management and trading of options on Canadian, US and European equities and ETFs. He also manages various cross-asset portfolios, which include Canadian and US fixed income and global equities. He has taken on numerous roles since joining BMO Financial Group in 2002, including Manager of Investments for BMO Asset Management Inc. where he was responsible for mutual fund manager monitoring and selection. In this role, he was also responsible for overseeing the currency hedging program across the mutual fund platform. Chris holds a BBA from York University’s Schulich School of Business and is a CFA charterholder.

Chris has more than 14 years of experience in the investment industry and currently serves as portfolio manager for equity-based and derivative-based ETFs. Chris also trades equity options and foreign exchange for the firm. He holds two degrees including a Master of Finance from the University of Toronto, Rotman School of Management (Dean’s List), and a Bachelor of Arts degree from the University of Waterloo, with studies in History and Mathematics, and is a CFA charterholder.

John has strategic oversight of the Tax Consulting team, seasoned tax specialists who support BMO Private Wealth Advisors and their clients by advising high net worth professionals, business owners and their families on practical and informed tax and estate solutions. Drawing on more than two decades of tax planning experience, he acts as a trusted resource, leading high-level planning discussions, presenting tax seminars and writing timely commentaries on emerging developments in his field.
John joined BMO Wealth Management in 2007, following 13 years at international accounting firm PricewaterhouseCoopers, where he led a team of tax professionals in the High Net Worth Planning Group in downtown Toronto. He is experienced in a broad range of tax and estate planning issues, including personal, corporate, trusts, partnerships, international and cross border, and not-for-profit taxation. John is recognized as a prominent subject matter expert and spokesperson on tax and estate planning for national print and online media and has also consulted on developing Canadian tax legislation.
John is a Chartered Professional Accountant (CPA, CA), CFP® professional and member of the Society of Trust and Estate Practitioners (TEP). He holds a Bachelor of Commerce (B.Comm.) from Queen’s University.

Nate has always been a massive fan of personal finance. In 2019, he realized how little financial education was talked about (especially among young adults) and decided to share that passion with the world.
To date, he has reached just over 150 million people organically with just under 225 million impressions with his content and aim to reach many more. 1,000,000+ followers across Instagram, Youtube, and TikTok (@newmoneynate) and his podcast New Money With Nathan Kennedy.

Omanand is a portfolio manager on the BMO ETF team focusing on equity, derivatives-based and multi-asset portfolios. Prior to joining BMO Asset Management Inc., Omanand was a Portfolio Manager at TD Asset Management on the Asset Allocation team where he provided ongoing risk management and tactical/strategic portfolio design of fund-of-fund solutions. He also helped develop new innovative solutions and manage option strategies. He holds a Bachelor of Mathematics from the University of Waterloo and is a CFA Charterholder.

Erin Allen has been a part of the BMO ETFs team driving growth since the beginning, joining BMO Global Asset Management in 2010 and working her way through a variety of roles gaining experience in client service, sales, and product development. For the past 5+ years, she has been working closely with capital markets desks, index providers, and portfolio managers to bring new ETFs to market that address the evolving needs of investors. More recently, Erin is committed to helping empower investors to feel confident in their investment choices through ETF education. Erin hosts the weekly ETF Market Insights broadcast, delivering ETF education to DIY investors in a clear and concise manner. Her focus is on supporting investors in their own investment journey. Erin has an honors degree from Wilfred Laurier University and her CIM designation.

Dr. Mark Soth completed training in respirology and critical care medicine at McMaster University in 2006 and is currently an Associate Professor in the Department of Medicine there. He led the development of his hospital ICU service into a multi-service Department of Critical Care at St Joseph’s Healthcare Hamilton. Currently, he serves as Department Chief and mentors other developing physician leaders. He has supported other physician and allied health leaders within his department to grow world class multi-disciplinary research and methodology programmes. Mark has a recognized passion for education and has won several clinical teaching awards. He is also a leader in curriculum development and was a founding co-chair of the Canadian Critical Care Review Course (CCCR) and the Mechanical Ventilation Workshop at CCCR. After a decade in these leadership roles, he has now shifted his focus to develop and deliver curriculum to improve physician financial health, career development, and well-being.

Larry M. Berman appears weekly on BNN Bloomberg’s Berman’s Call where Canadians look to him to deliver insights about market performance — with a focus on education, asset allocation, and prudent risk management.
Larry is a Chartered Market Technician (CMT), a Chartered Financial Analyst (CFA) charter-holder, a US registered Commodity Trading Advisor (CTA), and holds a BA in Economics from York University.
With 30 years of industry experience, Larry is a is a co-founder, partner and chief investment officer of ETF Capital Management and co-founder of Quintessence Wealth. Prior to founding ETFCM, Larry was chief technical strategist and managing director for CIBC World Markets – where he was ranked as one of Canada’s “Top 3 Analysts” including #1 in fixed-income according to Brendan Wood institutional investor surveys. Larry was also a senior technical analyst for Thomson IFR in Boston and senior technical analyst and trader for Marleau, Lemire Futures in Toronto.

Alfred Lee is a portfolio manager and investment strategist at BMO ETFs, where he currently leads the index equity team, a team which currently manages some of the largest ETFs in Canada. In addition to his portfolio manager duties, Alfred also serves as the investment strategist for the team, putting together trade ideas and model portfolios for institutional and retail clients. Prior to moving to equities, Alfred was a lead portfolio manager on the entire fixed income BMO ETF line up and also spent a year seconded to the Bank of Canada, managing their Provincial Bond Purchase Program (PBPP), one of the central bank’s emergency asset purchase programs in 2020. Prior to joining BMO, Alfred worked at two other Canadian banks as a research analyst, focusing on macro-economics and ETFs and also worked in an institutional consultant practice of a major bank.

The index investment strategy team provides research and commentary on the entire S&P DJI product set, including U.S. and global equities, thematics, commodities, fixed income and sustainability indices. She is also a frequent contributor to both print and broadcast media outlets.
Prior to joining S&P DJI, Anu worked in the asset management space, completing a post-MBA rotational program at Russell Investments within their fixed income research and trading divisions and working as a portfolio manager focusing on emerging market equities at Parametric Portfolio Associates (subsidiary of Eaton Vance).
Anu is a CFA charterholder and holds an MBA in finance and economics from Columbia Business School, and a bachelor’s degree in finance and marketing from NYU’s Stern School of Business.

Jennifer has been with BMO Capital Markets Economics for over two decades and is perhaps best known for her analysis on the U.S. economy, as well as her commentary analyzing financial market and economic activity in Europe and Japan. Her entertaining, easy-to-understand and call-it-like-it-is writing style has earned her a devoted following. Jennifer is also one of the primary authors of the Department’s hugely popular daily AM Notes, providing analysis of major global economic and political events. She is also co-author of Rates Scenario, covering currencies and markets outside of the U.S. and Canada. Jennifer is also a regular in the media and is a frequent guest on Bloomberg.
Prior to joining BMO, Jennifer was an economist at another Canadian bank for a few years in economic research. Jennifer graduated from the University of Waterloo with a Bachelor of Arts degree in Economics.


Richard has over 19 years of experience in the financial services industry. His key responsibilities include leading growth in BMO ETFs’ business, raising product awareness, and delivering a world-class experience to investment advisors and portfolio managers. He possesses product knowledge spanning across traditional and alternative investments.
Richard previously served as Director Equity Derivatives, CRM at TMX Montréal Exchange, where he oversaw the options market. His mandate was to develop the derivatives business by helping investment advisors and investors use options. He contributed for many years to the development of the derivatives market and has held increasingly senior positions during his tenure at the Montréal Exchange, where he carried out interactions with various market participants from the buy side to the sell side. Before joining the Montréal Exchange, he was at Desjardins, onboarding and relationship management for active traders at Disnat Direct.
Richard holds a number of industry designations including Derivatives Market Specialist (DMS®), Fellow of CSI (FCSI®) and is a Chartered Alternative Investment Analyst (CAIA®) Charterholder. He is an alumnus of John Molson School of Business, Concordia University with a BComm in Finance and Management Information Systems.

Adrian is the founder of the YouTube channel “Canadian in a T-Shirt” where he creates content that breaks down topics related to personal finance, investing, taxes, credit cards and how to start a business for Canadians! His content is easy to digest, energetic and informative and created specifically for do it yourself investors.


Marina Mets heads up Fixed Income and Multi Asset Product Management & Research in the Americas. Building on her prior role in the Research team leading the Canadian Fixed Income business, Marina works closely with FTSE’s partners and key clients, including major asset owners, fund managers and investment banks to develop and broaden FTSE’s fixed income offering globally. Marina leads a team focused on targeted client engagement to design and provide index solutions, educate the market on FTSE’s index philosophy, and profile use of indexes in investment portfolios and strategies across all asset classes.
Marina has been with the Fixed Income Index business for 20 years, starting her career in the capital markets research team at Scotiabank, and continuing on with the Canada fixed income index business through its acquisition by TMX Group in 2006, and the subsequent acquisition by FTSE in 2013.
Marina holds a Bachelor of Commerce, specializing in Finance, Accounting, and Economics, from the Rotman School of Management at the University of Toronto, and is a CPA CMA.

Jonathan Chevreau runs FinancialIndependenceHub.com. He is the author of Findependence Day and co-author of Victory Lap Retirement. He was a Personal Finance Columnist for National Post from 1993-2012 and Editor-in-Chief of MoneySense Magazine from 2012-2014. He is currently the Investing Editor at Large for MoneySense and writes its monthly Retired Money column.

Camilo Gil joined CIBC Capital Markets in 2010. He recently took on expanded accountability leading CIBC Capital Markets’ Canadian Delta 1 derivative business in addition to his role as head of ETF and Retail Block Trading. In this capacity, Mr. Gil is responsible for institutional sales, market-making and risk management across all ETF asset classes.
Mr. Gil’s team advises existing ETF manufacturers and new market entrants, and continues to play an integral role in the launch of new ETF products.
Mr. Gil’s experience includes specialized knowledge of exchange traded funds, market structure, market-making, arbitrage, direct market access (DMA), algorithmic trading, electronic connectivity and execution. He was instrumental in the launch and development of CIBC’s capital markets capabilities and client relationships in Latin America.
Previous to his current role, Mr. Gil developed and maintained relationships with institutional accounts and hedge funds in relation to DMA, algorithmic trading and electronic connectivity.
Mr. Gil is an active supporter of United Way and participates in a number of community events and sponsorships annually. He graduated from McMaster University with a Bachelor of Commerce degree with Honours.

Greg Walker is Director, ETF Capital Markets and Strategic Relationships at BMO Global Asset Management. Before re-joining BMO, Walker was head of institutional ETF sales for Vanguard Investments Canada Inc. and global head of ETF distribution at RBC Capital Markets. He also served as executive vice-president and head of institutional and national accounts at Evolve ETFs and was head of iShares business development at BlackRock Asset Management Canada
Greg started his career at Bank of Montreal and has held various investment roles including high yield debt analyst and portfolio manager in a fixed income investment management group specializing in credit risk assets.
Mr. Walker earned an HBA in economics and financial management from Wilfrid Laurier University. He is a CFA® charterholder and has held positions on a number of investment industry boards, including the Buy-Side Investment Management Association (BIMA), Canadian Security Traders Association (CSTA) and the board of Women in Capital Markets (WCM).

Graham MacKenzie is the Head of Exchange Traded Products and leads the ETF and Structured Product businesses at the TMX. In this role, Graham is not only tasked with growing the TSX’s ETF footprint but also focused on nurturing and fostering the adoption and use of ETFs in Canadian investment portfolios. Graham joined the TMX after an 18 year career as an equity trader that included managing multiple trading businesses. During this time he was at CIBC where his responsibilities included Portfolio Trading, Head of the Retail Execution Services and Retail Block Trading desks. Prior to CIBC, Graham worked at RBC Capital Markets where he was a pioneer in the Canadian portfolio trading business. At both CIBC and RBC, Graham was responsible for managing corporate trading relationships and advised issuers on corporate buybacks, building toehold positions and disposing minority stakes. He began his trading career as an options trader on the floor of the Toronto Stock Exchange with RBC. Graham and his wife, Michèle, are the founders of Ready, Set, Play Children’s Charity which is a Toronto based charity that provides funding for underprivileged children to participate in recreational sports and dance.

Pat Bolland has been in the investment industry for more than 4 decades. Pat started work on the floor of the Toronto Stock Exchange as a phone clerk for McLeod Young Weir. Over a decade he progressed through retail and institutional sales to help take MYW to a leadership position on Bay Street.
Pat spent the next 25 years in media; as TV-host at BNN and SNN; on-air business editor at CNBC and CBC; radio host on CFRB; and writer for Moneysense, Sun Media and AOL.
Despite all his media, business and sport ties he still gets stopped on the street, usually by someone who states … “You’re the guy with the ‘stache’!
")
ETF Market Insights est la principale ressource éducative au Canada pour les investisseurs canadiens en FNB de tous âges. Chaque semaine, nous explorons un nouveau sujet avec des experts en la matière, et nous invitons notre public à soumettre des questions pour obtenir des réponses réfléchies de nos panélistes.
ETF Market Insights est fièrement parrainé par BMO ETFs et a lieu tous les vendredis à 13h00 HNE. Les rediffusions de tous les épisodes sont disponibles chaque semaine après la diffusion en direct. Vous pouvez accéder aux archives ICI..
Nous avons hâte de vous éduquer chaque semaine!

Rosa is a corporate engagement practitioner with 10 years’ experience in the responsible investment industry and joined BMO GAM’s Responsible Investment team in early 2020. Rosa specializes in North American corporate governance and engaging management and board members on ESG. She leads BMO GAM’s Responsible Investment Stewardship strategy and efforts, which includes corporate engagement, proxy voting, public policy advocacy and industry collaboration. She serves on the Responsible Investment Association’s Leadership Council, the Canadian Coalition for Good Governance’s Environmental & Social Committee, Climate Engagement Canada’s Steering Committee and the Advisory Committee for the Investor Alliance for Human Rights. She holds a BA in Political Science and an MSc in International Development Studies from the University of Amsterdam.

Adriano has been investing on his own since 2011 and tried many different investing techniques, eventually focusing exclusively on “Income Oriented” Investing starting in 2018. A major investment in 2019 (Home Sale) led to Financial Independence (FIRE) at 34 years old. In March 2020, Adriano and his wife Erica created the YouTube Channel Passive Income Investing which has over 40k subscribers. This channel showcases their “Income Oriented” approach which is designed to generate high passive income by investing in ETFs and Funds that hold quality companies and use income enhancing strategies such as covered call ETFs.

Paul Riccardella is an Executive Director and Head of Wealth Indexed Investments Coverage at MSCI Inc., a publicly traded company (NYSE: MSCI) and a leading global provider of investment decision support tools including indexes, ESG/Climate, real estate and portfolio analytics. In his capacity at MSCI, Paul leads a team that works with professional investors in North America that use index tracking instruments like ETFs and Direct Index SMAs to build client portfolios. Prior to joining MSCI in 2011, Paul worked at Putnam Investments for seven years, a Boston based asset manager, where he specialized in working with due diligence and research teams at the largest wealth management firms. Paul holds an MBA from the Kellogg School of Management and a BA from Boston College along with memberships to the CFA Society and CAIA Association of Boston.

TD Direct Options Education Month
ETF Market Insights’ Danielle Neziol joined TD Direct on Thursday, June 9th @ 1:00pm ET to talk about accessing options strategies to generate passive income using covered call ETFs. Click here to watch the replay.

ETF Market Insights x HardBacon:
A Conversation on Inflation
Danielle Neziol sits down with Julien Brault, founder of Hard Bacon, to provide an update on Inflation and discuss how ETFs can help hedge portfolios against some of the risks involved with rising inflation. Streaming live on HardBacon’s YouTube Channel, Tuesday May 31 @4pm EST.
![]()
ETF Market Insights x Build Wealth Canada:
Are You Holding the Right Bonds in Your Investment Portfolio?
Danielle Neziol speaks with, Kornel Szrejber the host of the Build Wealth Canada Show (A top personal finance and investing podcast for Canadians). to discuss fixed income ETFs. Listen to the podcast here.
ETF Investing In Canada: The Ultimate Guide To Passive Investing
Let’s talk about ETF Investing in Canada! Passive investing using ETFs is taking the world by storm, and it is by far, one of the easiest ways to invest in the stock market. What is an ETF? How do they work? What are the best ETFs to buy in Canada? Brandon Beavis covers all of that and more in this video! Watch the video now.
ETF Market Insights is Canada’s leading educational resource for Canadian ETF investors of all ages. Each week we explore a new topic with subject matter experts, and we invite our audience to submit questions for thoughtful responses from our panellists.
ETF Market Insights is proudly sponsored by BMO ETFs and occurs every Friday at 1:00PM EST. Replays of all episodes are available each week after the live broadcast. You can access the archive HERE.
We look forward to educating you each week!

Brandon Beavis was one of the youngest people in Canada to become licensed as an Investment Advisor, at the age of 20. After a few years working at his father’s investment firm, he decided to take his knowledge directly to the DIY investor by using YouTube as a platform to share his investment knowledge and expertise. He has grown his channel Brandon Beavis Investing to one of the largest Canadian-focused personal finance and investing channels with over 180k subscribers in addition to educational resources on The Investing Academy, which has empowered over 1,500+ Canadians to educate themselves on personal finance via video courses, live session, Q&As, and community chatrooms.

Ellen Roseman is a journalist who sticks up for ordinary Canadians. She’s been advocating for consumer rights for the past 40 years.
When you hear about consumer issues in Canada, you can’t avoid finding references to Ellen Roseman. She’s become a brand name for activism and a champion at helping consumers fight back against injustices. People praise her direct, down to earth and common sense writing style.
Ellen’s personal finance and consumer columns appeared in the Toronto Star for 20 years until 2019.
She was the Star’s business editor for two years (1997-1998). Before that, she was with the Globe and Mail as a columnist and associate managing editor of the Report on Business.
Her books, Money 101: Every Canadian’s Guide to Personal Finance, and Money 201: More Personal Finance Advice for Every Canadian, are an easy-to-understand introduction to personal finance for those of us who are short of time and money.
She’s the author of four other books, Ellen Roseman’s Money Guide for Modern Families, Canadian Parent’s Sourcebook, Canadian Consumers’ Survival Book and Consumer, Beware! The most recent book is Fight Back: 81 Ways to Help You Save Money and Protect Yourself from Corporate Trickery.
She’s been teaching courses in investing and personal finance at the University of Toronto’s continuing studies department since 2004. Her specialties are learning how to invest for beginners and how to become a smart consumer.
Ellen is a former board chair and current director of the Canadian Foundation for Advancement of Investor Rights (FAIR Canada). She also hosts the MoneySaver Podcast, sponsored by Canadian MoneySaver magazine.

As the founder and leader of Sparx, Hamish has always been drawn to big ideas and impactful projects. He has a knack for puns: he once convinced a potato to fall in love with an onion – the secret was to teach them how to be mutually a-peeling.
At SparxTrading.com, we believe DIY investors deserve access to quality, objective information about online brokerage industry that services them. By constantly researching, monitoring and compiling data into an easy to access format, SparxTrading.com has become Canada’s leading and most comprehensive website for DIY investors to compare discount brokerages as well as to get the latest information on deals & promotions offered by Canadian online brokers.